Long idea on RMIRMI is one too watch here as it moves above the Weekly 200EMA, perhaps breaking out of the range its been trading in. A close above 3355 on the weekly chart will be continued bullish momentum for price.
OUT trade ideas

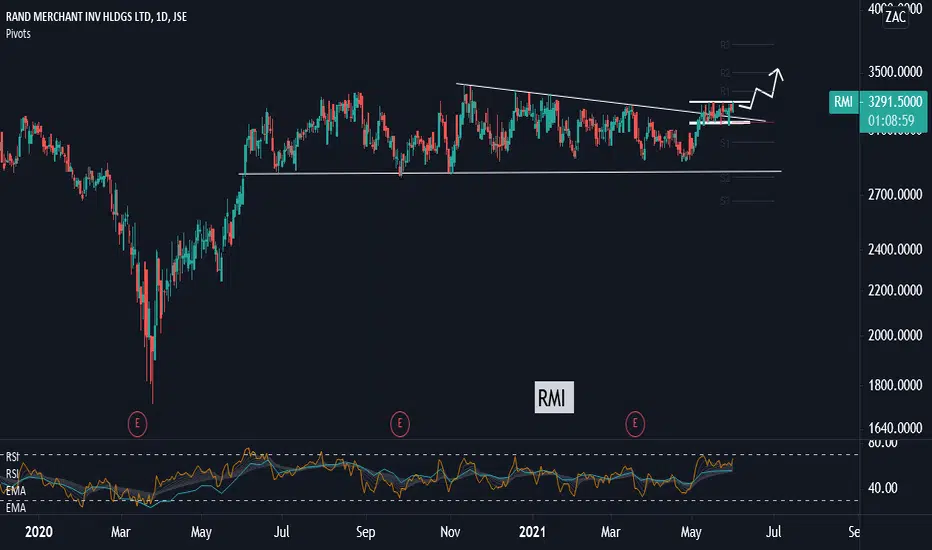
RMI Looks like it's developed a flag in recent weeks. Also, breached the downward trend line extending back the 11 Nov 2020 highs. Has traded sideways for an extended period but now appears to be eager to advance. Can make a push to the late 3500's, then +3680, then 3800c over the medium term. Stop: 3130c.
Both daily and weekly RSI's in a bullish regime.
Current: 3292c
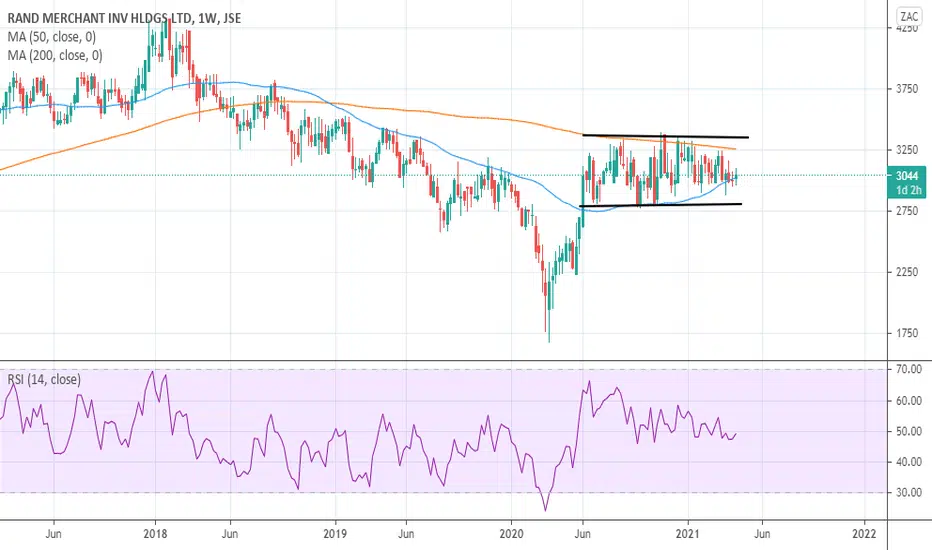
Rand Merchant InvPrice consolidating between the 50dma and 200dma, on the weekly.
Watch out for a break!
$JSERMI Rand Merchant Investment Holding. Consolidating This share has been stuck in a trading range between 3360 and 2930 for 280 days. A break above 3360 will be quite an achievement and would indicate a target of 3800 to a level where strong resistance could be met. Currently this one is good for a watchlist only.

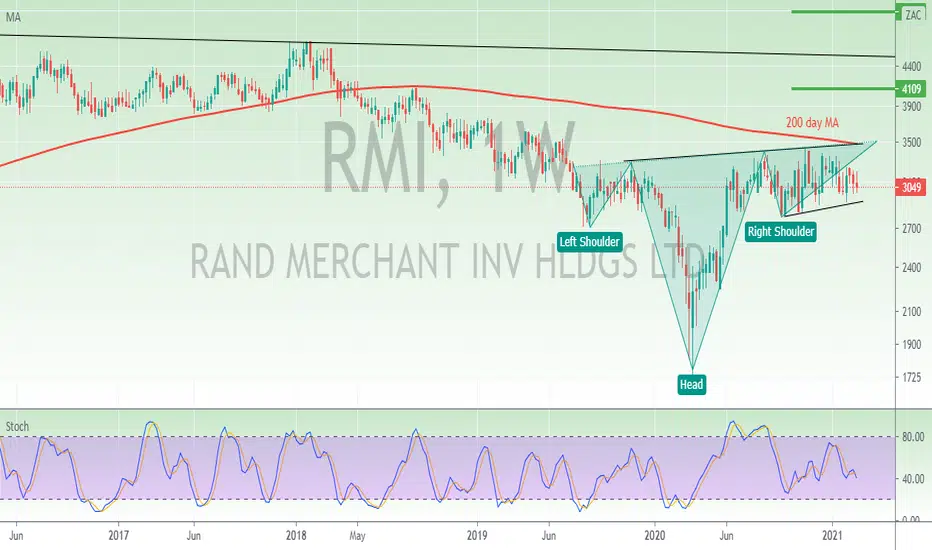
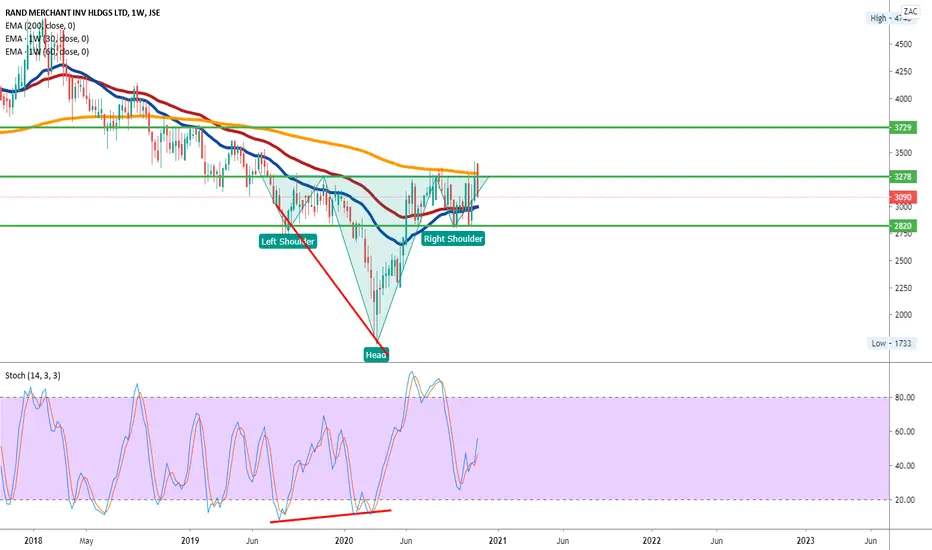
RMI - 1W - INVERTED HEAD AND SHOULDERSRand Merchant Investment holdings moving in a sideways channel for some time now. Building a big right shoulder on this inverted head and shoulder formation. Since stochastics are in no mans land i will not enter trade quite yet. You could buy at the bottom of the channel and wait or buy at the breakout to the top which will also breach the 200 day MA, and confirm the Head and Shoulder formation. Targets to the top will be juicy.
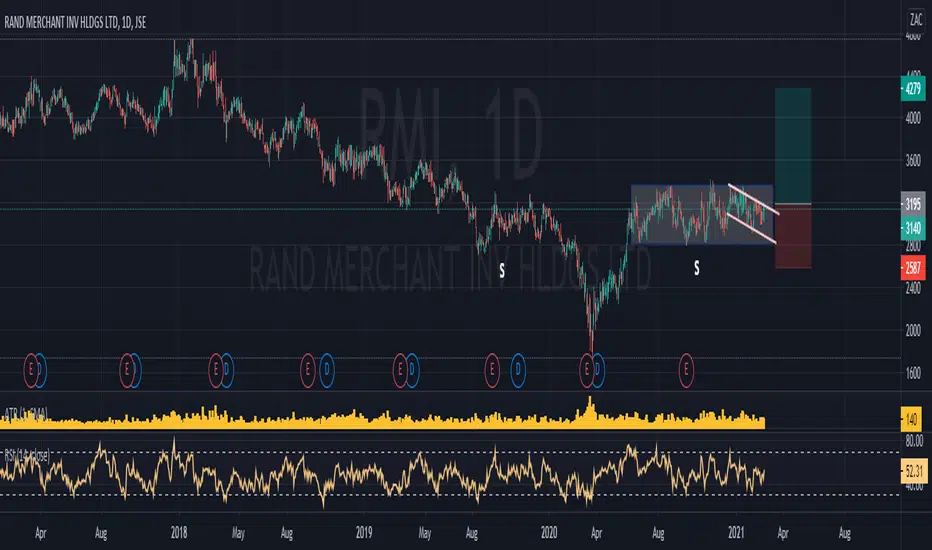
RMI 5 month box Consolidation Pending breakoutwaiting for breakout to confirm.
aggressive entries here with tighter stops also can be a good idea.
RR 2:1
Bullish divergence, Head and Shoulders, and Ascending triangle We had a nice bullish divergence pattern on the stock. The share since made higher lows and ultimately forming a head and shoulders pattern. To add to the wind the right shoulder formed an ascending triangle pattern. I;m looking for a break above the 3278c neckline. My minimum target on the trade is 4804c
Checkout the weekly game plan: villagetrader.co.za

An Inverse Head and Shoulders after a bullish divergence on RMIWe have a nice looking inverse head and shoulder pattern on Rand merchant. The formation of the left shoulder and the head, also saw the share had a bullish divergence. I’m looking for a break above the neckline at 3278c. The 30w EMA is looking to cross the 60w EMA (my trend indicators).
Waiting for a breakout on RMIJSE:RMI is trading in a neutral triangle pattern for now, but a breakout could be imminent. Depending on the direction of the breakout, we could be in for a nice move. I will keep an eye on this one before making any decisions.

JSE:RMI Rand Merchant MarkdownFollowing Rand Merchant Investments distribution and markdown (see posts below) since 2018 price has marked down significantly. Volume has been increasing on declines and decreasing on increases. RMI is weaker than the market. Price is now approaching a significant volume node from the previous markup. However, there has been no significant volume spike indicating a selling climax so price is expected to continue declining. However, one should watch for significantly increasing volume indicating buyers stepping in.

JSE:RMI Rand Merchant Inv Next Leg DownFollowing the distribution and now the markdown for RMI (see posts below) we seem to be ready for the next leg down.

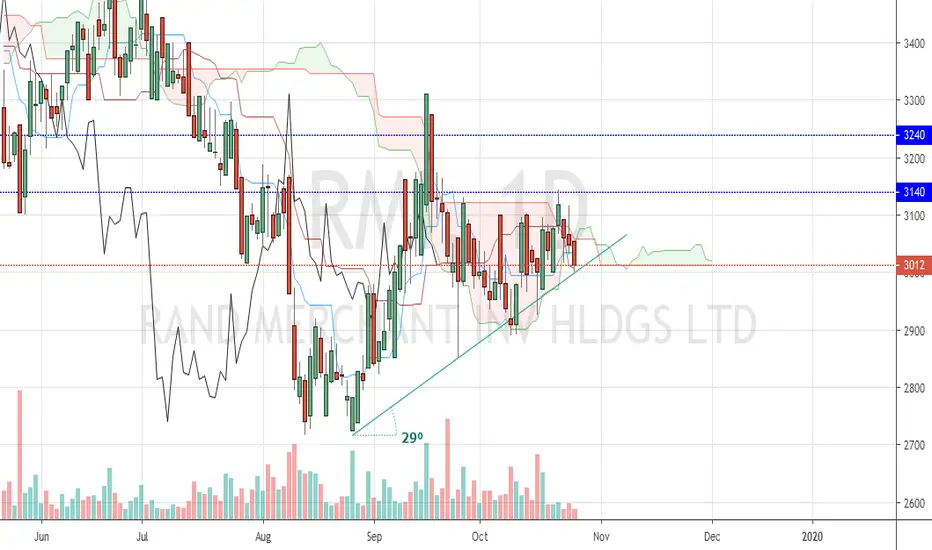
Trend Line supportThere is a trendline that seems to be getting respected from end of August. I expect this to continue and will turn last weeks 3 bearish daily candles into bulls this week. Also supporting this thesis is the fact that on the monthly we seem to be getting rejection from a support area that was initial resistance broken in April 2014.
Entry: 3 small positions close of Friday's candle 3012
SL; 2953
TP1: Short Term 3140
TP2: Medium Term 3240
TP3: Long Term 3530
Risk Management is King. . . .
JSE:RMI Rand Merchant Inv Markdown ContinuingRMI has undergone distribution and is now in the markdown phase (see posts following distribution below). The expectation is for the markdown to continue after the recent correction.

JSE:RMI Following the DistributionI have been following the distribution of Rand Merchant Inv play out since October 2018 (See posts below). The distribution and backup seem to be complete and the markdown seems to be starting.

JSE:RMI - Engulfing BearThe previous higher low at 35.28 took a while to break support at ~33 which has now been broken by a big bearish engulfing.


RMI (Rand Merchant Insurance)200-day MA @ R33.27 could provide some resistance....if we gain momentum from here next level would be around R34.

RMI Is About To Make A MoveRand Merchant Investment (RMI) Holdings is an investment holding company with a portfolio of insurance and investment products targeted at the commercial, corporate, retail and public sector. The group’s history can be traced back to 2010 with the spinning off of insurance assets from Rand Merchant Bank (RMB) Holdings, FirstRand and Remgro. RMI Holdings shares were subsequently listed separately on the Johannesburg Stock Exchange (JSE), although RMB Holdings and RMI Holdings still share the same management team.
Technicals
On the weekly time frame, we can see a corrective structure formation, indicated in pink. The daily time frame, indicated in blue, shows a 5 wave corrective structure which has completed. This would indicate that there should be a break to the upside soon. This break will be the start of wave 4 on the weekly structure.

JSE:RMI Rand Merchant Investments Markdown to start?Last year I followed the distribution pattern on RMI (See post below) which now seems to be completing. Price had found support at the at the bottom of the Trading Range (TR) but was unable to rally back the top of the TR. After some consolidation, we see a change of character bar (Significant reversal bar). RMI could now be ready to break out and start the markdown.

JSE:RMI Rand Merchant Investments DistributionRMI has been looking week since April 2015. After the Buying Climax (BC) and Automatic Rally (AR) was formed the stock has been week and kept moving below the trading range. After some last effort to move to the top of the trading range we see volume drying up indicating that the large players have completed the distribution after the initial increase in volume. The OBV has shown divergence with the price. After breaking the 200 Week MA was broken and retested it looks like the stock is ready to be marked down. The next significant points of interest could be as low as 2662 or even 2257 which is about a 30% decrease in price.
