$JSESLM - Sanlam: More Upside In Impulse MoveThe last coverage of Sanlam was on 25.05.2023, link below.
Price held above 5021 which was the stop-loss level and the bulls certainly re-emerged taking price towards 6400.
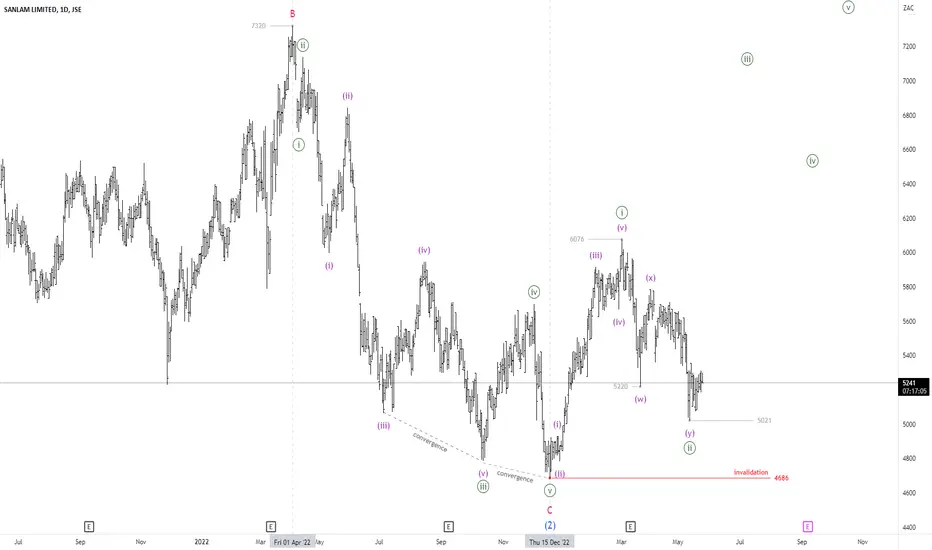
The rally from 5021 is unfolding as a five wave impulse and is in wave v of (iii) of ((iii)).
Buy the dips is the medium-term strategy as the wave count suggest more upside in store.
SLM trade ideas

SLM Partial Close, Leave The Remainder To RunSLM Partial Close, Leave The Remainder To Run
Thus far a +6% gain depending on your entry.
Also, my earlier this morning.
The short/sell idea is currently in the money between 4.9% and 6.4% (ungeared), depending on your entry.
Traders could consider scaling out as the share approaches the target (5532c) or bank/take profit in full.
The idea was to sell at 6055c or higher. It traded as high as 6153c, safely away from the stop-loss (6374c).
Yesterday's close was 5758c.

Counter-Trend Masochism, Part 1 JSE:SLM Everything says don't do it. The trend is exceptionally strong with this one. But if you have a penchant for masochism, note that:
- Momentum has slowed in recent days. not faded, but slowed.
- RSI @77 is ready for some normalization
- MACD has slowed and started abating somewhat.
Technically it looks like it's stalling in a nicely defined supply zone of R59.90 to R60.84.
Nicely defined stop around R63.00 (although you have to scratch back some time to find it)
I'm shorting at or around R60.50, target R54.10 stop R63.02. However don't bet the farm.

SLMPreferred sell at 6055c or higher. As per this morning's note, the share is trading with high bullish momentum however approaching an overbought range. For short term traders, this sets up a countertrend sell opportunity. Live price at time of writing: 6009c. Time stop: 28 July 2023.
TRADING LEVELS:
Entry: 6055
Target: 5532
Stop-loss: 6374

Sanlam broken out of Falling Wedge target to R63.69Falling Wedge formed since 1 Feb 2023.
Only yesterday, we had the confirmed breakout showing strong buying and demand.
Price>200 Bullish
RSI >50
Target R63.69
SMC
Below the Wedge we have Sell Side Liquidity Order block. Where Smart money is buying where retail were selling. This gives a strong signal that high buying volume was trumping selling.
Very bullish for the stock.
ABOUT THE COMPANY
Early Roots: Sanlam was founded in 1918, originally as a life insurance company named The South African National Life Assurance Company.
Public Company: In 1998, Sanlam demutualised, changing its status from a mutual life insurance company owned by its policyholders to a public company listed on the Johannesburg and Namibian Stock Exchanges.
Wide Range of Services: Sanlam provides financial solutions in a broad range of areas, including insurance (life and general), financial planning, retirement annuities, trusts, wills, short-term insurance, asset management, risk management, and capital market activities.
Global Presence: Sanlam operates across 33 countries. It has a particularly strong presence in Africa, where it operates in many of the continent's major markets.
Five Business Clusters: Sanlam's operations are organised into five business clusters: Sanlam Personal Finance, Sanlam Emerging Markets, Sanlam Investments, Sanlam Corporate, and Santam.
Santam Subsidiary: Sanlam owns a majority stake in Santam, which is South Africa's largest short-term insurer.

$JSESLM - Sanlam Ltd: 4686 Holds Firm, Will Bulls Re-emerge?The last coverage of Sanlam was on 2023.01.04 and the wave count was suggestive that a bottom was potentially in at 4686, link below.
Sanlam had a strong, impulsive looking rally from 4686 to 6076.
The correction to 5021 is a clear three wave move labelled as a double zigzag (wxy).
Long positions can be opened at current prices with an aggressive stop-loss below 5021.
Price can still correct further down but I will maintain my bullish stance as long as price remains above 4686.

Best Probability Demand-Supply Zones: SBK, WHL, SLMBest Probability Demand-Supply Zones: SBK, WHL, SLM
From my research notes today.
For access to frequent insights, get in touch today.

Pair trade: Selling SLM vs Buying OMUOMU likely to outperform SLM?
A price action below 4.9240 supports the idea that SLM is likely to underperform OMU.
Increase the short exposure for a break below 4.8725,
The target price is set at 4.6680.
The stop-loss price is set at 5.1285 (upper range of the linear regression channel pattern.
Notice how the linear regression channel pattern is sloping downwards (supporting SLM to underperform OMU).
A life insurance pair trade idea involves taking a long position in one life insurance company (OMU) while taking a short position in another life insurance company (SLM. The goal of this strategy is to profit from the relative performance of the two companies.

DOUBLE COMBOSanlam is trading in what I believe to be a triangle at X-wave. A breakout to the downside will confirm our bearish bias.

SLM: some rebounding?The chart is the 4-hourly chart.
A price action above 5400 supports a bullish trend direction.
Increase long exposure for a break above 5600.
Target is set at 5700, which is the middle of the Bollinger Bands.
Stop-loss at 5400 and will negate the bullish bias as well.
The stock recently started rebounding from oversold territory (see the lower panel).
The share is rebounding from its oversold condition, indicating that buyers have entered the market, and the share's price is likely to increase in the near term.
This type of correction can be seen as a sign of a potential reversal in the share's trend and may signal a buying opportunity for traders looking to take advantage of the rebound.
Furthermore, the share crossed above its 200-day - changing the sentiment towards it.
Remains a risky trade.


Sanlam breakoutJSE:SLM breakout with massive volume. The price is also above the 2022 mid-August high of R59.50/share. Financial services could be onto something.

SANLAMSanlam bounce of the lows a recovery is at play R61 rand is on the cards even a move higher to R72 is possible


$JSESLM - Sanlam Ltd: Bullish Above R46,86From the April 2022 peak at R73,20 Sanlam stock corrected strongly to what appears to be a potential bottom at R46,86.
The decline unfolded in five waves and bullish MACD/price convergence with a MACD trigger signal increases confidence that a reversal is imminent if it has not already began.
I highly recommend a stop-loss below R46,86.

SANLAM - Triggered and looking goodA short was triggered on JSE:SLM this morning and it has already moved quite nicely in our favour. Let's hope this momentum continues all the way to our take profit level.

RISING WEDGE FORMATIONThe rising wedge is a reversal pattern that can be used in trading. In this chart there is a bigger correction & the rising wedge is forming. I expect the price to break down sharply to the bottom.
We are also looking at zero crossover to confirm the medium term sell
Good luck!

SANLAM - LongWhen JSE:SLM breaks through the 5230 level we will enter long based on the stochastic, MACD and the crossing of the two EMA's.

Leg C of 335 ABC CorrectionSanlam is in what looks like a 3-3-5 Elliott Wave Correction. It has formed a Head and Shoulders pattern, but yet to break the neckline. We can see a drop to 2000 region should the neckline break.

SLMAccording yesterday’s pre-market price action model (see extract on chart), the setup was to sell on a failure to holding the highs. The share closed lower by 3.14%. For more on how to use the model to find opportunities, get in touch today.

SLM Sanlam SLM (Last Close 6206c) - Considering The Potential For An Ultra Short Term Bullish (Buy/Long) Reversal. Pre-Market View.
Last week Tuesday (pre-market) the provisional sell range was 6820-6860c. The share traded into the mid-point of this zone (on the same day) with a print of 6840c and as at yesterday's close, declined by 9.2% or -634c.
Yesterday's session saw the share close lower by 2.76% and is approaching it's short term incline trend line support. The 7-day RSI is 30 (weak, but 'near oversold') and the 7-period 4-hour RSI is 16 ('oversold'). Also noted is the share trading at 2.5x it's 20-day linear regression channel.
Potential Scenario For Today: The share opens lower and crosses below the trend line, then attempts to reclaim it (either via a 'doji' developing today with follow-through tomorrow or a long lower wick). This is approximately in line with the swing lows of 19 May however could also trade as low as the swing lows of 13 May (see green shaded area). This is approximately in the range of 6055-6130c (Please note: We could also overshoot this range and failure to hold this range with deteriorating price action will temporarily invalidate the idea).
The yellow arrow represents a potential price path however is not guaranteed to play out in this manner.
An alternative scenario would be the price opening higher today thus traders could wait until the provisional level is reached for the idea to be triggered.

SLM - Covering Short Idea SLM - last week Tuesday I published this short/sell for clients, based on:
1. A 'near overbought' rating
2. Test of 61.8% FIB.
From ~6800c, we are seeing a print of 6400c (down by 5.8%). Not a high conviction level to go long but we could see it rebound moderately as it back-tests the trend line breakout and nears the incline support.
Now 6394c, this may be a level to cover the short/sell.
