Piercing Line Pattern on SANLAMA piercing line candle pattern has formed on JSE:SLM . This is a good bottom reversal signal. If it plays out, we could be seeing a nice upward move from here. Target levels at the highs from mid-Feb.
SLM trade ideas

SLM retest of breakoutSLM broken out of a long consolidation and retesting the previous resistance. First target will be R72 and second target R80.
Trade ideas are my own and not financial advice.

Potential Inverted H&S on SanlamAn inverted H&S is forming on JSE:SLM . It hasn't quite reached the neckline, but it could potentially do so soon. Our momentum indicators are also showing a buy signal. If it breaks the neckline, I will enter long.

Relative Ratio: JSE Insurers vs JSE BanksThe following content is an extract from this morning's client research.
In terms of single stocks, one of my ideas is a local pairs (market neutral) trade idea from the commodities/mining sector. For more insights and real-time ideas, or if you are considering an alternative trading services provider get in touch today.
Another chart/insight published to clients is the attached ratio chart highlighting the performance of JSE Insurers vs JSE Banks. I think this ratio/relative chart is something we need to pay attention to over the medium term , especially from a relative sector allocation perspective.
Text as follows:
"JSE Insurers (Equally-Weighted) vs JSE Banks (Equally Weighted) | The daily chart shows insurers potentially starting to outperform vs banks as it develops a double bottom formation while the weekly 14-period RSI (lower panel) shows the indicator printing a positive divergence."
Disclaimer: The above content should not be considered an investment recommendation.

JSE:SLM Long oppsPrice breaking higher out this triangle and closing above the EMA200. There is a key technical SR level at 6500 and price needs a close >6550 to show continuation of bullish price action. Good spot for a long pos here. Always manage your risk

SANLAM - Buy Long Idea- After the previous trade going to take profit, price and retreat back to a level which presents a good opprtunity to go long again
- SL and TP on the chart
- Previous trade in link below
-- MANAGE YOUR RISK - -
Disclaimer: All ideas are my opinion and should not be taken as financial advice.

SLM rangeSLM been trading in a range between R60 and R65. It is trading at the bottom of the range. If a reversal takes place here it can go back to test R65 again.
Trade ideas are my own and not financial advice.
Sanlam limitedI've taken a position in Sanlam at R62.52, expecting it to break 20% to the upside within the next 6 months.
I have a stop loss at around R54 - which will confirm a lower low.
At the moment, I am seeing an ascending triangle formation with strong resistance at R65, and higher lows after each pullback.
I believe it will break to the upside as this is a bullish.
Let's see how it plays out.

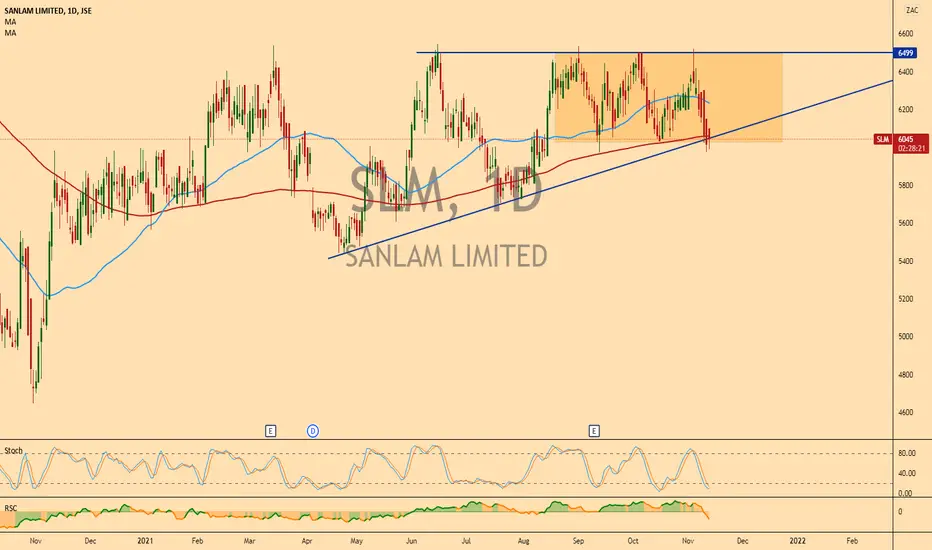
SANLAM - Long Swing Idea- Price has pulled back to the 200 day moving average and up trendline which offers a favourable entry to target the highs
- Stochastics in oversold territory
-- MANAGE YOUR RISK - -
Disclaimer: All ideas are my opinion and should not be taken as financial advice.

SLM back to supportSLM pulling back to support and its 200dma. A reversal up from these levels it can rally back to resistance at R64.50
Trade ideas are my own and not financial advice.

AG Capital -Storm trading Morning Call 13 September 2021We give a quick recap of markets overnight and the previous day and insights into the day ahead with a few trade ideas on the day. Ideas are strictly NOT INVESTMENT ADVICE.

Long idea on SLMThere is a nice ascending triangle setup forming here. Price is currently testing the 200WEMA which is acting as resistance with the trend line, A close above 6500 and a long position can be initiated with a ST limit at the Jan2020 highs at 7880. This trade has good RR, and the LT trend is still up. As always manage your risk. Good luck out there

SLM reversalSLM weekly chart. SLM pulling back to support in the form of a flag. If triggered we can see a bounce to resistance around R64 - R65 area. A break above that then R70 as second target.
Ideas are my own and not financial advice.

Ascending triangle still in the makingSLM is still within it's ascending triangle formation with a potential to test the lower trendline. Short term R60 seems to have held but a move close to R58 could be a good entry with previous swing lows at R54,40 as a stop loss while a move above R65 will trigger the breakout on this pattern.

Some wind behind SanlamLooking at the daily chart there’s quite some wind behind this trade. We have a combination of a golden cross, a pull back to the 50 day EMA that holds, inverse head and shoulders pattern, the right shoulder forming a falling wedge. Plus the cup and handle pattern from the weekly chart. I will start building my position on the break through the neckline close above R63 with a stop loss just below the right shoulder and falling wedge, around R60. I’m considering starting to build the position on the break of the falling wedge, but a half the risk. Starting the trade with a 0.5% risk and putting a full position on the break of the neckline and the close above the high close of the falling wedge at R64.90. Unless the break of the falling wedge also breaks the neckline in which can I will put on a a full position (1% risk)

Sanlam Last week Thursday (pre-market) our tactical perspective suggested: "Aggressive Buying But Do Not Chase-Look For Overshoot and Failure To Hold Highs To Short-Sell Back To The 8-EMA" - see related.
The price has since has since retreated, but may be heading lower, setting up a potential rebound buy for ultra short term or day traders.
What's the range to buy? I'm looking at around 5940c down to 5880c, using a stop-loss of 5805c.
It's an ultra short term idea, so let's remain nimble.

SLM: correction back to its 200-day?Bearish MACD crossover supports downside price potential.
RSI leaves enough room for further downside price potential.
Below 6210 supports a bearish trend. Breaking above this level, will change the trend to bullish.
The 200-day might act as major support.

SanlamThis morning, our tactical model for SLM suggests the following: " Aggressive Buying But Do Not Chase-Look For Overshoot and Failure To Hold Highs To Short-Sell Back To The 8-EMA ".
A manual review of the chart notes the price at a clear supply zone however we know it has the ability to overshoot.
If it trades above resistance and fails to hold, does that set up a short term short/sell ? I'm monitoring for entry.
Note: the 7 and 14-day RSI's trade at 80 and 74 respectively - strong but nearing 'short term overbought'.

SLM - Weekly Ascending triangleA weekly close above R65 triggers the long idea with full target at R85. Stop loss is a close below R55. The pattern is still developing and as long as previous swing lows of R55 holds the patter is on and pullback towards R60 and lower could be a better entry.

SLM - R60 resistance levelIt will be key for SLM to close above R60 in order to have a chance to retest swing highs. Otherwise it will start to form a right shoulder on the bigger H&S pattern

SA Banks & Financials packing their bag for a short trip south Well, everything on the globe is being marked down, and this includes SA banks & financials, despite much improving underlying fundamentals.
Prices for all of them are now under their 5EMA which is under their 15EMA. In this weak sentiment environment I'm looking for them to give back another 5% or so before bargain hunters like myself can't resist the risk. JSE:SBK target the R113-R115 area JSE:FSR target R48ish JSE:ABG target R116-R118 JSE:NED who knows and even JSE:CPI looks ready to retrace to the R1450 area.
Conversely stated, in the current environment the probability of these counters going up 5% is a LOT lower than them going down 5%.
In the background the fundamentals are improving - manufacturing data, bankserv transaction data, etc - so if they do dip nicely that would present a great opportunity to buy, imho. In short, take your profits and fall back :-)
Happy trading!
UC


SLM - Sideways consolidation breakBroken on Friday out of its consolidation above R56.80. First target at R58.60 and full target at R60.
