STXFIN: some upside potential?A price action above 1700 supports a bullish trend direction.
Further bullish confirmation for a break above 1750.
The target price is set at 1800.
The stop-loss price is set at 1650.
Remains just above its 23.6% Fibonacci retracement level.
STXFIN trade ideas

STXFin - Do we go for swing highs??Price rallied well off support and now bulls will want to hold it above R1590-R16.10 to attempt a move towards swing highs.
The momentum looks favourable in the sector.

Strong gap and drive breakout + bullish engulfing on FINIBeautiful gap and drive breakout + a retest of the resistance line from the other side on STXFIN ETF signaling a strong run from the financial stocks. With a stop halfway through a the gap. with a target at the R18 high. provides a decent risk reward. I'm still bearish on the overall market and bullish on the finiancials

Satrix FINI - Downtrend ResistanceSTXFIN is approaching an area of interest...
The downtrend resistance has been in place since April '22
I would be cautious on financials unless we recapture the 200dma

Financials could be heading back down.Looking at the Satrix Fini, The recent bounce has merely served as a re-test of the "new resistance". If financials fail to break through this level, we could be in far a much larger leg down so be cautious about getting suckered into rallies. I still believe that we are in "short the bounces" mode. This set up is pretty simple to trade. If financials fail to get above that resistance you can go short with relative confidence. AND if they break through strongly and find support above this level you can expect a stronger move higher. As things stand I still think the short trade is more likely.

SATRIX FINI - Bounce to trendline- STXFIN looking to breakthrough R15.50 again to go test the trendline at R16.00
- Oscillators turning up from oversold
-- MANAGE YOUR RISK - -
Disclaimer: All ideas are my opinion and should not be taken as financial advice.

SATRIX FINI - Analysis- The STXFIN has hit strong resistance, a downtrend line starting from April this year
- It will be interesting to see if the moving averages provide support here else a deeper pullback towards the swing lows will be on the cards.
-- MANAGE YOUR RISK - -
Disclaimer: All ideas are my opinion and should not be taken as financial advice.

Satrix FIN ETF 🧐- Price is in a short term down trend and is below the 200 day moving average (black line)
- Next decent support is in the R13.30-13.60 zone
- Trend remains down while we make lower lows and lower highs
-- MANAGE YOUR RISK - -
Disclaimer: All ideas are my opinion and should not be taken as financial advice.
If you would like me to have a look at any chart, direct message and i will post my thoughts, Happy Trading!

$STXFIN Satrix Fin. Ominous looking head and shoulders The fund invests in the 15 largest financial companies listed on the JSE, ranked by investable market cap.
Head and shoulders formed with the right should on top op the 200 day moving average support line
A break of this support could see a price target of 1239. A long way down.

STXFIN: higher highs and higher lowsA bullish trend is applicable above 1630.
Crossing below this level will negate the bullish trend.
RSI is leaving enough room for further upside potential.
Expect some consolidation between 1660 and 1720.
Crossing above 1720 might support the price action to reach the target price.
Remains a risky trade.


SATRIX FIN ETF - 52 Week HighSatrix Fini has made a new 52 week high as it approaches upper trendline and area of interest
-- MANAGE YOUR RISK - -
Disclaimer: All ideas are my opinion and should not be taken as financial advice.

SATRIX FIN - Swing Idea- Price found support at previous breakzone
- Stochastics turning up from oversold
- Looking for a move to towards the top trendline while we remain above support
-- MANAGE YOUR RISK - -
Disclaimer: All ideas are my opinion and should not be taken as financial advice.

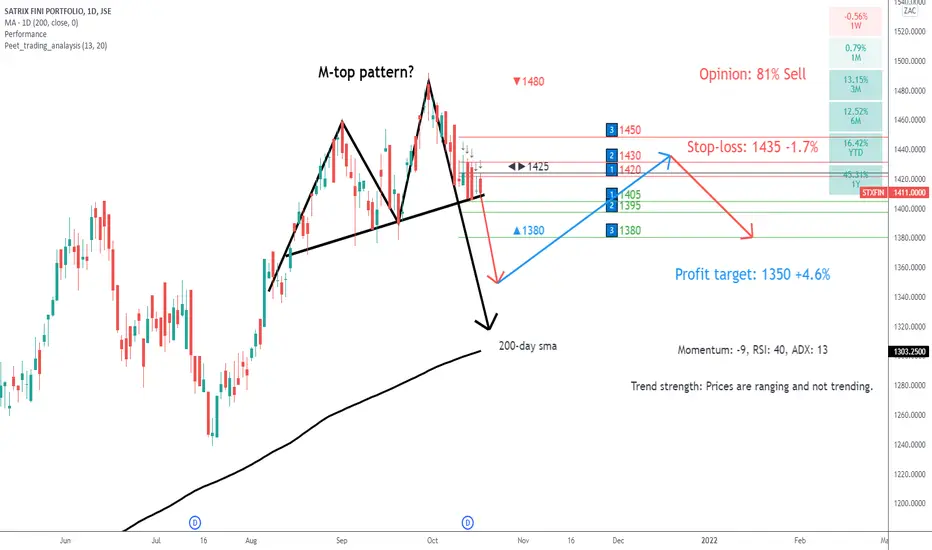
STXFIN: some further weakness?At some major support.
However, downside price momentum supports a bearish trend.
RSI leaves enough room for further downside price potential.
M-top pattern might support the bearish trend.
Might we see the price action back to its 200-day?
JSE:SATRIX FINI Don't Get Swept Up in the ExcitementLast week the JSE Financials were on the move but before jumping on the train a word of caution. If one looks back to 2015 we see a long distribution range that formed with investors getting out of South African financial stocks. The recent rise on the back of the covid drop is likely to only be a backup to this distribution range and not longer-term interest in the financials. Using SATRIX Fini as a proxy we see the volume has been declining since the upthrust (UT) that took place at the end of 2017 / beginning of 2018 highlighting the lack of interest. The relative strength to the Top40 is also declining. We are now spiking into the an area of previous high volume so it is rather time to watch and see what the reaction will be than just jumping in.

JSE:STXFIN JSE Financial Index Time to GoThe Financial Index of the JSE has shown some strength and this week it is time for the mark up back to the Support that is now likely to be resistance and test the area between 1400 and 1600.

Financials rolling over- The Satrix Financials ETF chart is starting to show that our basket of financial stocks is beginning to roll over. RSI and oscillators are showing price fatigue and weakness creeping in. A 10% correction is not a crazy notion. I reckon this one is a convincing short back to around R10.50 (200 day moving average).

STXFIN Satrix Financial 15 ETF. Bull flag brokenGood looking bull flag broken and 1340 looking like a likely target.

$STXFIN Satrix Fin 15 Index ETF. Bullish looking flag buildingTarget for this flag break would be 1340. Wait for a break

JSE Financial Index: In Phase B of the Trading RangeThe financial index on the JSE has remained at the low levels after the drop. After the selling climax (SC) and automatic rally (AR) which demarcates Phase A of the Wyckoff trading range, we have seen the typical low volume trading in Phase B play out. Phase B typically takes some time to develop and we may have to wait sometime into next year to see significant action to start taking place. For now, the range seems to be bound between 900 and 1200 and I am not expecting many great trading opportunities. Only some range trades on well-selected stocks seem to be in play.

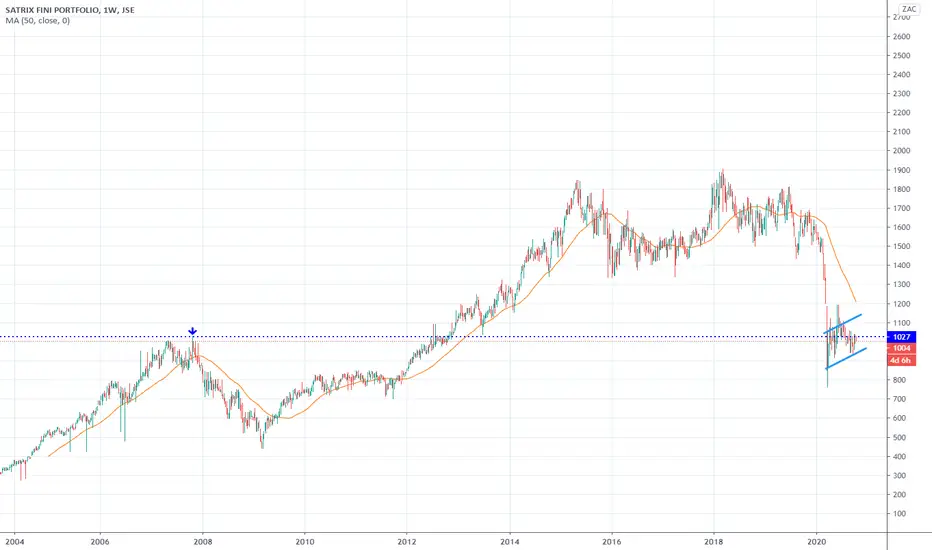
$JSESTXFIN Satrix FINI ETF. Road to nowhereTracked 15 locally listed financial companies, including all of South Africa's major banks, life insurance providers to absolutely nowhere in the last 13 years. The current price level is almost exactly what it was in 2007 almost to the date. Poor performer and a reflection of the poor state of the economy. One to watch if by some miracle the SA economy manage to grow from current levels.
STXFIN - Bear flag breakout- Expect the local STXFIN to be weaken over the days ahead
-- MANAGE YOUR RISK - -
Disclaimer: All ideas are my opinion and should not be taken as financial advice.
JSE:STXFIN

JSE:STXFIN JSE Financials Markdown or MeltdownFollowing the Wyckoff logic of the markets the distribution trading range (Started in 2015) of the JSE financial index has been broken and the markdown (meltdown) has started. The upward stride has also been broken. The financial index is also performing poorer than the Top40 index. We could have a backup to the trading range with price finding support as previous support levels of 1200 / 1100. After the backup, we can expect the markdown to continue.
