(To The) Sun International? (To The) Sun International?
Above the monthly and quarterly pivot. Looking to break out of pennant?
SUI trade ideas

SUN INTERNATIONAL - Long Idea- Price is back to an area of support and volume has picked up
- Looking for a move up here towards R30 level.
- Stop loss Below R25
-- MANAGE YOUR RISK - -
Disclaimer: All ideas are my opinion and should not be taken as financial advice.

SUI: more downside potential?The potential for a repetitive price action remains of interest (see the two black arrowed trendlines).
A price action below 2960 supports a bearish trend direction. Crossing above this level will negate the bearish stance.
MACD crossover (in overbought territory) confirmed a change in trend direction.
Downside price momentum supports the bearish trend.
RSI is leaving room for further downside price potential.

SUI 4hr good volumes todaySUI forming a bullish flag after breaking out its medium term bear channel. more upside can be expected from this sort of pattern.

SUI descending triangleSUI breaking out of a descending triangle. First target at R32 and second target R35.50.
Trade ideas are my own and not financial advice.

Strong breakout on Sun InternationalJSE:SUI has made a strong upward move in the last two days. It is up over 11% in just today's price action. Currently it is trading at a strong trendline. It could either bounce off and make it's way down before turning up again, but if it breaks through, I think we can potentially see an extended upward move.


Long idea on SUI There is a nice bull flag forming here with a good R/R. Long term trend is still down,be careful when trading against the trend.

Sun International Ready to Come Out of Cloud $JSESUISomeone asked about leisure & travel shares, the chart of Sun International looks interesting. Has a large ascending triangle that has broken out & price has formed a bull flag just above the point of breakout. This looks great for a run towards R30 & consolidate. If the SA variant of COVID doesn't prove to be a headache this might continue to go up since Emerging markets are supported into a bull market.
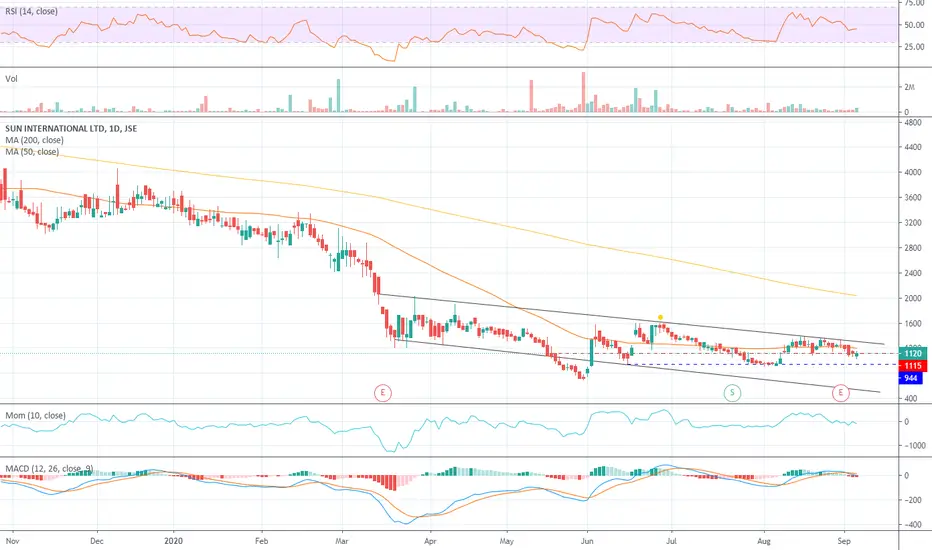
JSE:SUI - Clings to support (D)JSE:SUI - Briefly loses support (1115) before recovering to close above (1120)
A break below open 944 as the next target lower with the falling chanel
Sun International 2020R20 = 4 Aug
R22 = 6 Sep
R24 = 4 Oct
R26 = 9 Nov
R28 = 7 Dec
R30 = 11 Jan
1 March R33.25

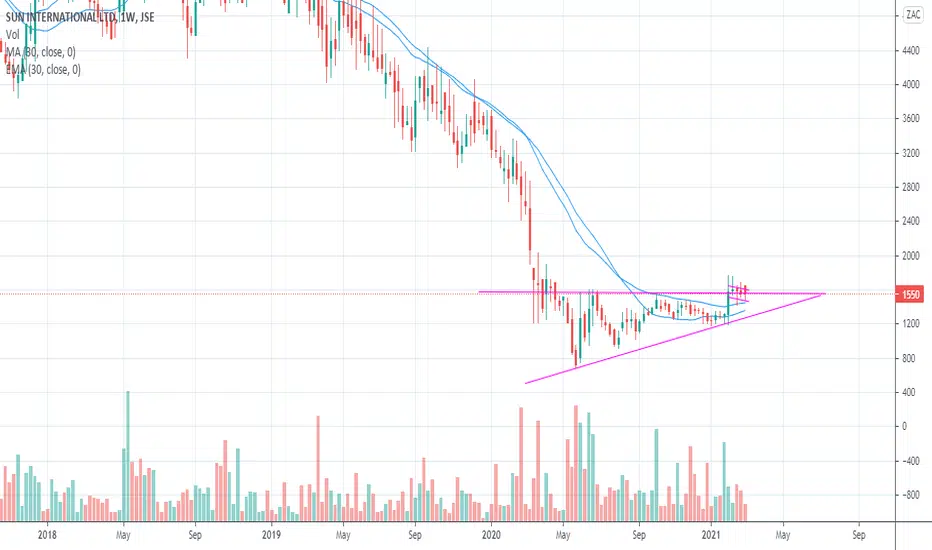
Rectangle BreakoutWatching this for a potential rectangular breakout if we can get cleanly through the 1800 zone. Would open up an initial target at 2400. Potential acquisition target too.

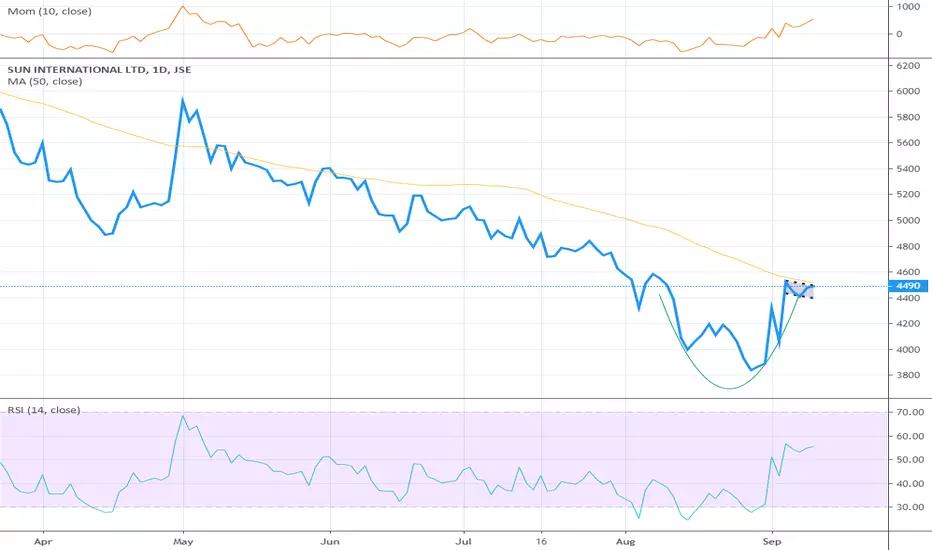
$JSESUI - C&H formation, looking for a b/o$JSESUI has formed a C&H pattern and looking for a b/o above 4500 (14d MA 4524)
Both MOM and RSI look +ve and support the possible move higher.