$JSESYGUK Sygnia UK ETF. Xmas might come early this yearVery bullish looking flag building on this EFT. Lots of open air above this bull flag when it breaks. I have a position open.
Key stats
About SYGNIA ITRIX FTSE100
Home page
Inception date
Oct 10, 2005
Replication method
Physical
Dividend treatment
Distributes
Primary advisor
Sygnia Asset Management (Pty) Ltd.
ISIN
ZAE000249520
The investment policy of the Sygnia Itrix FTSE 100 ETF is to track the benchmark FTSE 100 Index as closely as possible, buying only FTSE 100 securities
Related funds
Classification
What's in the fund
Exposure type
Finance
Consumer Non-Durables
Health Technology
Energy Minerals
Stock breakdown by region
Top 10 holdings


$JSESYGUK Sygnia Itrix FTSE100 ETF - Testing bottom of channelThis ETF is starting to challenge the bottom of this consolidation channel. Could point to some more downside if this channel is breached.
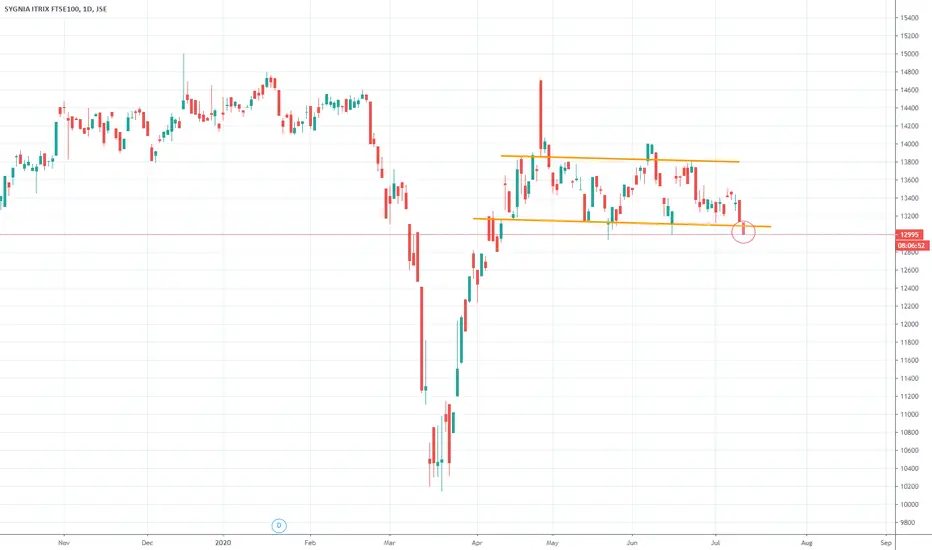
$JSESYGUK Sygnia Itrix FTSE100 ETF - ConsolidationQuite a few ETF's have entered a period of consolidation after a period of expansion. The Sygnia Itrix FTSE100 ETF is one of those. After periods of expansion, comes periods of consolidation. Periods of consolidation can be followed by either a period of contraction or further expansion. Very diffic

See all ideas
Summarizing what the indicators are suggesting.
Oscillators
Neutral
SellBuy
Strong sellStrong buy
Strong sellSellNeutralBuyStrong buy
Oscillators
Neutral
SellBuy
Strong sellStrong buy
Strong sellSellNeutralBuyStrong buy
Summary
Neutral
SellBuy
Strong sellStrong buy
Strong sellSellNeutralBuyStrong buy
Summary
Neutral
SellBuy
Strong sellStrong buy
Strong sellSellNeutralBuyStrong buy
Summary
Neutral
SellBuy
Strong sellStrong buy
Strong sellSellNeutralBuyStrong buy
Moving Averages
Neutral
SellBuy
Strong sellStrong buy
Strong sellSellNeutralBuyStrong buy
Moving Averages
Neutral
SellBuy
Strong sellStrong buy
Strong sellSellNeutralBuyStrong buy
Displays a symbol's price movements over previous years to identify recurring trends.
Frequently Asked Questions
An exchange-traded fund (ETF) is a collection of assets (stocks, bonds, commodities, etc.) that track an underlying index and can be bought on an exchange like individual stocks.
SYGUK trades at 21,696 ZAC today, its price has fallen −1.02% in the past 24 hours. Track more dynamics on SYGUK price chart.
SYGUK net asset value is 217.54 today — it's risen 0.92% over the past month. NAV represents the total value of the fund's assets less liabilities and serves as a gauge of the fund's performance.
SYGUK assets under management is 1.21 B ZAC. AUM is an important metric as it reflects the fund's size and can serve as a gauge of how successful the fund is in attracting investors, which, in its turn, can influence decision-making.
SYGUK price has risen by 0.17% over the last month, and its yearly performance shows a 11.69% increase. See more dynamics on SYGUK price chart.
NAV returns, another gauge of an ETF dynamics, have risen by 0.92% over the last month, showed a 2.89% increase in three-month performance and has increased by 12.44% in a year.
NAV returns, another gauge of an ETF dynamics, have risen by 0.92% over the last month, showed a 2.89% increase in three-month performance and has increased by 12.44% in a year.
SYGUK fund flows account for −7.65 B ZAC (1 year). Many traders use this metric to get insight into investors' sentiment and evaluate whether it's time to buy or sell the fund.
Since ETFs work like an individual stock, they can be bought and sold on exchanges (e.g. NASDAQ, NYSE, EURONEXT). As it happens with stocks, you need to select a brokerage to access trading. Explore our list of available brokers to find the one to help execute your strategies. Don't forget to do your research before getting to trading. Explore ETFs metrics in our ETF screener to find a reliable opportunity.
SYGUK invests in stocks. See more details in our Analysis section.
SYGUK expense ratio is 0.89%. It's an important metric for helping traders understand the fund's operating costs relative to assets and how expensive it would be to hold the fund.
No, SYGUK isn't leveraged, meaning it doesn't use borrowings or financial derivatives to magnify the performance of the underlying assets or index it follows.
In some ways, ETFs are safe investments, but in a broader sense, they're not safer than any other asset, so it's crucial to analyze a fund before investing. But if your research gives a vague answer, you can always refer to technical analysis.
Today, SYGUK technical analysis shows the buy rating and its 1-week rating is buy. Since market conditions are prone to changes, it's worth looking a bit further into the future — according to the 1-month rating SYGUK shows the buy signal. See more of SYGUK technicals for a more comprehensive analysis.
Today, SYGUK technical analysis shows the buy rating and its 1-week rating is buy. Since market conditions are prone to changes, it's worth looking a bit further into the future — according to the 1-month rating SYGUK shows the buy signal. See more of SYGUK technicals for a more comprehensive analysis.
Yes, SYGUK pays dividends to its holders with the dividend yield of 1.44%.
SYGUK trades at a premium (0.76%).
Premium/discount to NAV expresses the difference between the ETF’s price and its NAV value. A positive percentage indicates a premium, meaning the ETF trades at a higher price than the calculated NAV. Conversely, a negative percentage indicates a discount, suggesting the ETF trades at a lower price than NAV.
Premium/discount to NAV expresses the difference between the ETF’s price and its NAV value. A positive percentage indicates a premium, meaning the ETF trades at a higher price than the calculated NAV. Conversely, a negative percentage indicates a discount, suggesting the ETF trades at a lower price than NAV.
SYGUK shares are issued by Sygnia Ltd.
SYGUK follows the FTSE 100 Index. ETFs usually track some benchmark seeking to replicate its performance and guide asset selection and objectives.
The fund started trading on Oct 10, 2005.
The fund's management style is passive, meaning it's aiming to replicate the performance of the underlying index by holding assets in the same proportions as the index. The goal is to match the index's returns.