TELKOM - Support here?- Telkom has pulled back to an area of interest. Bulls could step in at the R32-R33 zone and target swing highs or the 200dma
- Below R30 would negate the bullish view.
TKG trade ideas

TKG - Back in a buy zoneTelkom has pulled back into a buy zone and could be traded in a small range - 32.50 - 37.50 for the short term. Should it break out from this range, one could hold till it hits yellow overhead resistance. My stop would be a close below 31.50.

TKG - 1D - TELKOMHead and Shoulders inverse forming on this stock, Stochastics moving into oversold territory, Breakout will trigger long position. First target 55,24 , 2nd target 70,75 . Stop at 46,47. Might be receiving some positive news regarding the MTN buy out to trigger this move.

TELKOM - Pending Buyout- MTN is in the process of acquiring the remaining share of Telkom
- Evaluations have been cited of around R60+
- The inverted head and shoulders measured move would be perfectly validated if that is the case
-- MANAGE YOUR RISK - -
Disclaimer: All ideas are my opinion and should not be taken as financial advice.


TKG: volatility squeeze?A "Volatility Squeeze" occurs when the volatility of a share falls below its recent levels. A fall in volatility usually means that the share is in a period of consolidation and trending in a narrow range.
Such a scenario increases the likelihood of a break either to the upside or the downside.
Higher highs and higher lows, together with a test of the 200-day simple moving average support a break to the upside.
A price action above 4400 supports a bullish trend direction.
Crossing below this level will negate the bullish stance.
Remains a risky trade.

AG Capital -Storm trading Morning Call 22 April 2022We give a quick recap of markets overnight and the previous day and insights into the day ahead with a few trade ideas on the day. Ideas are strictly NOT INVESTMENT ADVICE.

AG Capital -Storm trading Morning Call 12 April 2022We give a quick recap of markets overnight and the previous day and insights into the day ahead with a few trade ideas on the day. Ideas are strictly NOT INVESTMENT ADVICE.

TKG: downside?A bearish trend is applicable below 4700.
Breaking above this level will negate the bearish stance
Remains below its 200-day simple moving average.
Downside price momentum applicable.
Trend strength indicates that a trend might be developing.

TELKOM -Long IdeaTelkom bounced off its primary trendline which offered an early entry
Price has just closed above the 50ma /200ma yesterday..
Pullbacks to R44-R45 may offer suitable entries for a move towards the up channel resistance. Below the recent swing low could open a possible bear flag break scenario...
-- MANAGE YOUR RISK - -
Disclaimer: All ideas are my opinion and should not be taken as financial advice.

Telkom200dma lost, as well as a 2-year old trendline dating back from March 2020.
They say "nothing good happens under the 200dma".
I won't be surprised to see 30 from here

Bottom of ChannelTelkom smacked to the bottom of the channel on bad results, interesting that the channel still held.
Would be interested to see if this can hold as support, or break for a further move down.

TKG: back to its 200-day?Downside price momentum supports the bearish trend direction.
Below 5100 supports a bearish trend direction.
Might we see the price action walking the lower Bollinger band?
Concern remains the absence of a strong trend according to the ADX.

Watching $TKG closelyLooking at $TKG on the weekly chart price is currently moving within the upper bound of the channel. Zooming into the daily chart price is forming an ascending triangle. A long pos can be initiated when price breaks out of the setup and closes >5600. In the near term price needs to close above the SR level of 5700 and look to test 6000 for validation of sustained positive price action.

TELKOM - Bearish setup I favour taking long setups to shorts but the Telkom chart is looking pretty bearish and could possibly pull back to R43.20 and then R36.50 if no support is found.
A close above R49.50 will negate the view.
-- MANAGE YOUR RISK - -
Disclaimer: All ideas are my opinion and should not be taken as financial advice.

Top of ChannelTelkom delivered a perfect playout, it still amazes me when these prices perfectly fit into these channels and lines.
Now to check for breakthrough or resistance, with earnings coming next week.

@VillageTraderZA - Breakout on TelkomThe stock had a strong breakout on Thursday. Making a new high and high close YTD. Providing a great buy opportunity with a short term target at R56 and a stop loss at R46.40

TelkomAscending triangle technical pattern developing on weekly; if confirmed, I'm calling it 70; medium-long term.
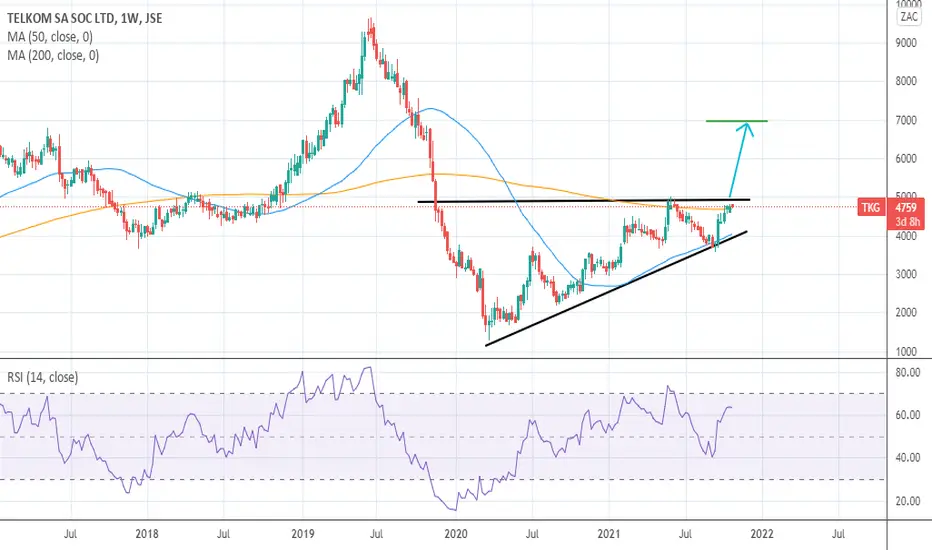
Watching TKG for a longPrice has formed this nice ascending triangle however if you haven't already bought TKG from its last break at 4400 then the R/R may not be suitable for a buy at a breakout of this setup. However if you are pyramiding then this is a decent level to buy more lots. Weekly volumes in this stock are a smidgen higher than the previous week, however the LT trend is up. Be wary of selling at the 5000 level. Always manage your risk

Telkom Shorty Macshort faceThis is what I see
Support line broke
50 EMA broken
200 EMA broken
Momentum waves to the down side
Money flow going into the red
See you guys at the the two fib levels, but most likely turn around on the 618 line. There could be some pull back to the 200 EMA but with money flow going into the red its just a formality.


AG Capital -Storm trading Morning Call 5 October 2021
We give a quick recap of markets overnight and the previous day and insights into the day ahead with a few trade ideas on the day. Ideas are strictly NOT INVESTMENT ADVICE.

AG Capital -Storm trading Morning Call 29 September 2021We give a quick recap of markets overnight and the previous day and insights into the day ahead with a few trade ideas on the day. Ideas are strictly NOT INVESTMENT ADVICE.
