TRU trade ideas

Symmetrical triangle pattern TruworthsJSE:TRU
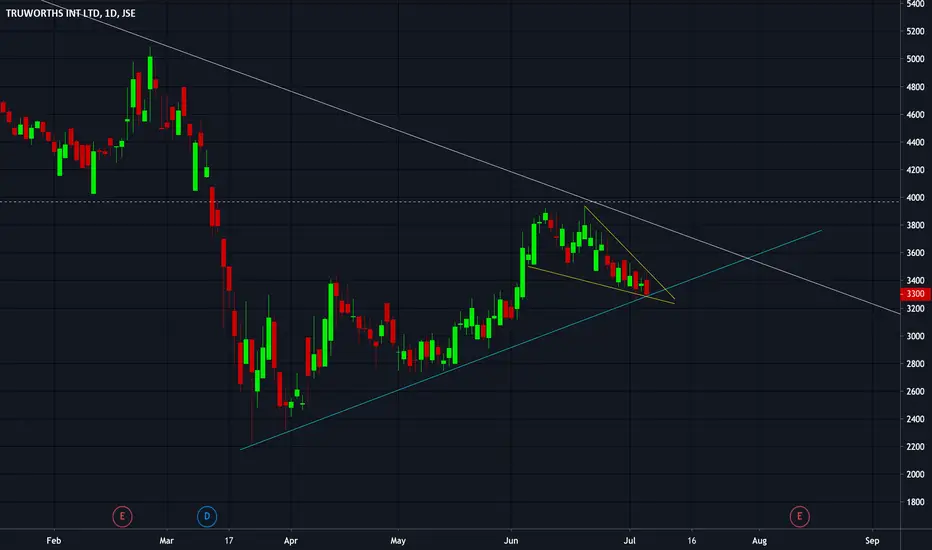
Truworths
The share has been on a downtrend downward, trading below the 200 week EMA. We have a symmetrical triangle pattern that formed. The share is now at ⅔ I’m looking for the break below the base of the triangle on the daily chart.
Full plan - villagetrader.co.za


$JSETRU - Stopped out Had to close this one out as it has now closed below TL support and wedge pattern failed to play out. Will possibly re-visit if it closes higher in the future.


$JSETRU - Possible long playTruworths currently testing TL support and has a small falling wedge. Taking a few longs here. Tight stop loss below R32 however.
$JSETRU - Testing TL support once againTruworths failed to breakout out to the upside and has now retraced all the way back to support. Probably a good bet for a long here with a tight stop loss if it closes below.

TRU Trade Levels:
- Short at current levels: 3669c
- If the share moves against us, a stop-loss of 3790c is suggested
- Take profit target: 3340c

$JSETRU - On the verge of a breakoutTruworths currently testing double resistance - but graph making nice rising bottoms. A strong close above 41.50 would be bullish (breaking its downtrend)

TRU 1hr up from supportTruworths hourly chart (currently 30.50) is rangebound between support at R29 (that coincides with the 200 period moving average) and resistance at R35.

Risky Clothing RetailersAfter President Ramaphosa announced on Thursday (23 April) that South Africa will be changing its lockdown status from level 5 to level 4, it was the clothing retailers that was hit the hardest. Main reason for this was because the initial draft for Level 4 lockdown did not permit the sale of any clothing yet. This saw most of the clothing retailers having a horrible day on Friday, with Truworths (TRU) being no exception (down 1.8% on the day). Subsequently, the Government however released a statement on Saturday (25 April), saying that the sale of Winter Clothing and Bedding, will now be allowed under Level 4. Although The Fochini Group (TFG) was hit the hardest (-7.1% on Friday), I believe from fundamental basis, TRU currently look a bit better. Read our full report on the company, which we released on Friday, here: oldoak.co.za
From a technical point of view, TRU is trading back at the levels it traded at post 2008 crash. It is also trading below all four its 8-, 21-, 50- and 200 week Moving Averages (EMA), which very much places TRU still in an extremely negative trend environment. The share price momentum is also still very much in the red.
I do however feel that the share price is now oversold and places the company firmly in value territory. Oversold are confirmed by both the 14-week RSI, which currently trade in EMTREME OVERSOLD territory and the FTSE/JSE All Share 1-year, relative indicator.
Based on valuations, I went long with my first nibble. At R21, I would buy my second and last tranche. Should we see a recovery this week, with a break and close above the 8-week EMA (R32.65), could see the share price test the bottom of the parallel channel at R34.50 next. A break and close above these levels could be incredibly positive, with next resistance point then being the 21-week EMA (at R39.80). My medium-term target on the company corresponds with our equity reports target of R45/share.

$JSETRU Truworths Getting close to financial crisis levels Truworths getting close to the lows of the financial crisis 2008-2009. No position.


#JSETRU - Trend Trade - Downtrend intact
- Bearish breakout to the downside , would like to see a close with a bit more volume.
- Opportunity to keep riding with the stock down, tight SL above R 51.50 else R55 for a wider stop.
- MANAGE YOUR RISK -
Disclaimer: All ideas are my opinion and should not be taken as financial advice.

$JSETRU - Triple bottom formed (4hr)$JSETRU bounced on the support for a 3rd consecutive time
Looking for a break above 5719 to confirm and TP around 6477

JSETRU - LONG Truworths - Last week ended with a nice bullish candle with volume
- Possible double bottom has formed
- Aggressive entry will be to go long at current price or wait till price closes above R58.75 on the daily timeframe.
- MANAGE YOUR RISK -
Disclaimer: All ideas are my opinion and should not be taken as financial advice.


$JSETRU - 3rd failed b/o on C&H formation (Hourly)$JSETRU run has come to halt, following other Retail names in this session.
It has now b/o on 3 occasions in the C&H formation but failed in each of the attempt
A close above 5625 (Upper trend line) is still +ve and failure could see if retrace back around 5585 before breaching the lower trend line (5441)

TRU: most oversold share on a multiple time frame analysisUsing the RSI to calculate overbought/oversold conditions over multiple time frames (daily, weekly, monthly)


JSE:TRU Truworths Breaking Below Trading RangeTruworths is breaking below the distribution trading range (TR) that was started in 2013. We have seen a backup (BU) to the TR and now the markdown is getting going.
