VOD trade ideas
$JSE-VODJSE:VOD
Manage to close above sideways consolidation.
Target for break out should be around previous high at 13500


VODACOM - TECHNICALS ARE BULLISH (JSEVOD)Hi Guys
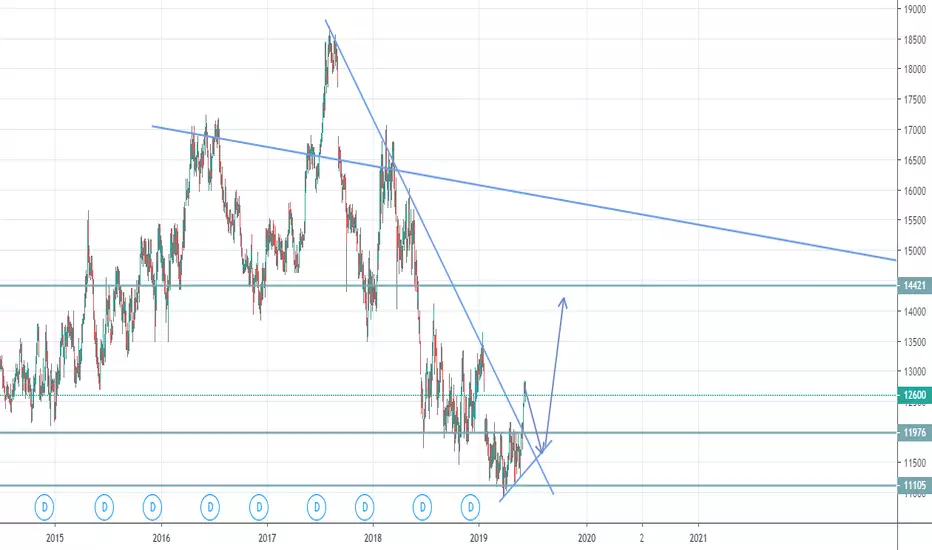
So having a look at VODACOM, we may derive the following from the weekly chart:
1. The recently formed base has shown a reversal pattern (the equidistant channel).
2. The weekly down trend (pink line) has been broken - we are approaching the major downtrend (grey line).
3. A test of the orange circle or resistance is possible and a break beyond that will signal a potential bullish run.
4. If you have not bought at the bottom, then you should exercise patience before entering into a trade. Wait for a good entry.
Let's see what happens.
Disclaimer: The aforementioned information does not constitute financial advice. CFDs are complex instruments and come with a high risk of losing money rapidly due to leverage. You should consider whether you understand how CFDs work, and whether you can afford to take the high risk of losing your money.

Vodacom breaks through top of sideways channelJSE:VOD has broken through the top of a sideways channel that it has been trading in since the 24th of Jan. It has broken out and confirmed the upward move by closing out of the channel twice.
There is also a gap that will most likely close. Just beware that it might find some resistance at gap close.


Pairs Trade Idea: Long VOD / Short MTN- 20 EMA starting to turn up slightly.
- RSI firming up.
- MACD pending center line cross.
- VOD pending breakout.
- MTN bear flag building.

Vodacan Breakout of this Falling wedgeVodacom starting to show some good volume in a consolidation with a pivot that's opened higher
We are in a huge falling wedge Upside potential to around R140
1st take Profit top of this wedge Channel

Short VodacomVodacom is approaching the top line resistance within a bear flag. Some might even call it a "consolidation" pattern. With the RSI pretty much in no man's land I am looking to short any bounce near R120.00 or better. A break above this "sideways" pattern would be considered bullish and that would be my signal to exit the trade and take a stop loss. With multiple resistance zones near that level where bounces regularly get sold, I expect more of the same. My target for now is R112.55. Let's see what happens...


VODACOM (VOD) DAILY TIMEFRAME LONGNever has there been so many multiple confluences on a single chart as this one. Firstly, price formed a head and shoulders pattern on the weekly chart, and tumbled down after the completion of the right shoulder and breach of the price below the the neckline. Secondly, prices have managed to stay under the neckline, which was a key psychological level at 14 000. You know how crazy people can be around round numbers. Also, the price is moving in a steady downtrend as depicted by the lower lows and lower highs and the descending trendline unmasks this. Price is now around the 12 000 key psychological area and the lower timeframes already show a rejection in the form of a bearish candle. I expect prices to continue going down. A fail-safe would be to wait for prices to approach the descending trendline and opening short position once clear signs are given.
I would like to thank all the readers and fans for showing love and supporting my content. If you want me to cover a particular asset/security, please dm me.

$JSEVOD Vodacom basing for a bigger move?$JSEVOD released a decent set of results this morning in the face of a tough economic environment which we have witnessed locally for the last little while. Perhaps now with elections out the way and a gradual uptick in economic activity, this local counter could benefit from inflows into the SA inc sector of our market. This year we have seen price action contained within a tight range of R110-R122. It has formed an inverted Head & Shoulders formation with multiple bottoms around the R111-R112 area. If we see the stock break above the recent highs of the neckline around R122, we could see this stock off to the races to test the upper end of the larger channel which comes in at roughly R132- R133.

TB and FWRWe have a triple bottom on Vodacom and a falling wedge reversal as well, can see it going up a little bit and also to close that market gap??

Vodacom'Bearish' consolidation on the VOD weekly.
A break of that might be what we need to take us to the R100 levels, which is the likely target for the H&S pattern that is playing out of the long term monthly chart.

JSE:VOD Vodacom Continuing the DowntrendVodacom has consolidated but after reaching the overbought trendline of the downward stride there was a clear change of character indicating weakness. The break of the TR range could indicate more downside to come.


Vodacom Group Pending Long (ST Idea)The share continues to trade in a sideways to downward channel, offering opportunities to participate on both the long (buy) and short (sell) side. At currently levels, the candle structure and moving averages suggest a move toward the lower boundary of the channel, and an opportunity to take a buy/log position below 10900c, using a stop-loss of 10650c and take profit target of 11400c.

Bullish Reversal on VODJSE:VOD formed a Bullish Harami reversal pattern on Friday.
It has already moved upwards quite significantly today, but will most likely continue to our target level at the next resistance

Pullback and shoot upWe are gonna have a little pullback on Vodacom, then we continue to go up on this downtrend

Vodacom in a bearish consolidation on the weeklyA weekly close below the R110/R111 area, is what will likely take us to the 'much anticipated' R100 area.

Vodacom: Bear flag still in playBear flag still in-place and playing out.
Also helping the case for the bears is the down-sloping trend-line which the price-action is so far 'faithful' to.
In the short-medium term, target is still R100.

Bear flag confirmed - will add on close below R111.75Bear flag confirmed - will add on close below R111.75
