WHL trade ideas
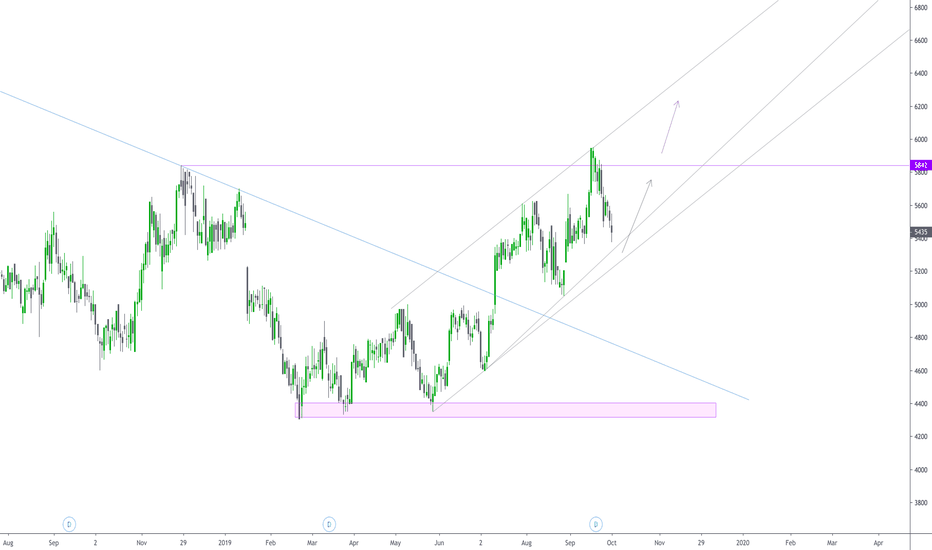
WHL - Potential Long SetupWe may derive the following from the Daily WHL chart:
1. Price has reversed slightly from the key resistance.
2. I am expecting price to come down to the rising trend line before moving up.
3. Monitor price action and wait for a good long opportunity.
4. As always - maintain your risk.
Note: The views provided herein do not constitute financial advice.
WHL - R60 Break Will Be RapidWe may derive the following from the Weekly WHL chart:
1. Price hasn't been able to break the upper weekly resistance (yet).
2. Price has come down a bit and may continue to do so before making a move higher.
3. Monitor carefully and wait for a good long opportunity.
4. As always - maintain your risk.
Note: The views provided herein do not constitute financial advice.
JSE:WHL | Bulls in the background suggest a buy at 5560Price ranged from early February this year all the way through to mid-July before breaking higher.
This extended period of accumulation which was followed up several bullish pushes higher suggests 6400 as a target.
We see price currently constrained in channel-type structure that looks likely to lead down to 5560 before the bulls really step in again.
I'm very interested in a buy at that level.
WHL - Almost at 1st TargetWe may derive the following from the Weekly WHL chart:
1. Price has almost reached our first target.
2. Price should in all probability test the first target / horizontal resistance.
3. Monitor price action and look out for further long opportunities.
4. As always - maintain your risk.
Note: The views provided herein do not constitute financial advice.
WHL: look at that bearish divergence!Using the RSI to calculate bullish/bearish divergence conditions over multiple time frames (daily, weekly, monthly).
Divergence period used is 8 periods (Fibonacci number).
Bearish divergence is when the price is making higher highs, while the indicator (RSI) is making lower lows.
Indicates underlying weakness. Bulls are exhausted. Warning of a possible trend direction change from an uptrend to downtrend.
WHL - Good ProgressWe may derive the following from the Weekly WHL chart:
1. Price has been extremely bullish over the past two weeks.
2. A slight pullback may occur before another push higher.
3. I do foresee price reaching 58-60 ZAR p/s.
4. As always - maintain your risk.
Note: The views provided herein do not constitute financial advice.


