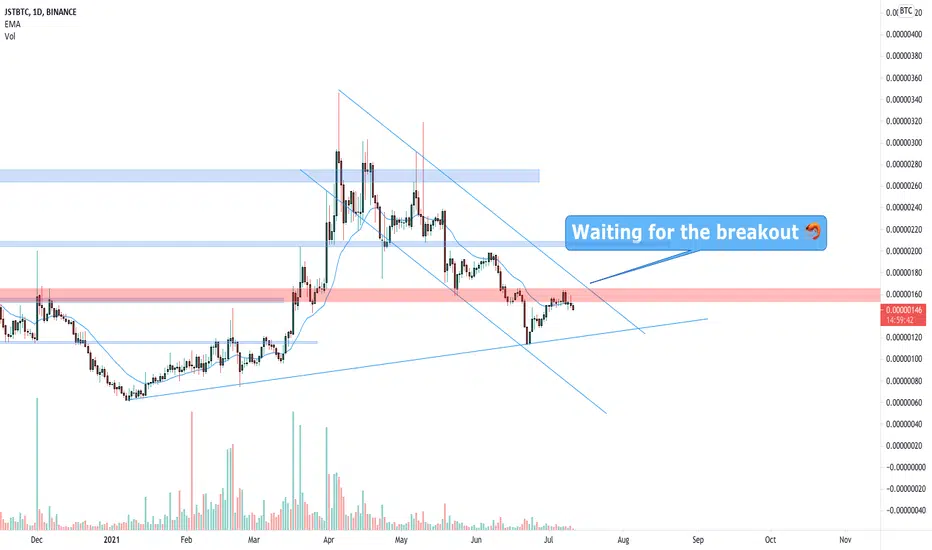
JUST | Long-Term Falling Wedge Leads To Long-Term GrowthGood day my fellow traders, can you feel it in the air?
Yes! If not, just take a look around this market; just take a look at the chart. JSTBTC, the JUST chart.
➢ Here we have a classic, ultra-accurate and long-term falling wedge pattern. This pattern is in the process of a bullish breakout based
Related coins

JST R-Bott After BD-Channel Opens 333% BU-PotGood day my fellow traders, here we have one of the many altcoins that are going to grow really strong, and fast, while Bitcoin, Ethereum and the rest of the big altcoins continue to crash.
We are looking at Just vs Bitcoin — JSTBTC.
Let's keep it simple...
➖ We have a rounded bottom (R-Bott) aft

✳️ Just Early Bottom Signal (New All-Time High 19-33X Potential)Good day my fellow Cryptocurrency trader, let's get back to the charts.
My main interest are the ALTSBTC pairs, if these grow the USDT pairs will also grow so there's your answer.
If the ALTSUSDT pairs grow the ALTSBTC doesn't necessarily follow but it do works in reverse. So seeing this many ALTS


JST LONG TERM LOW RISK HIGH REWARD JST in weekly chart looking very Bullish. In coming weeks it will jit it's all time high 🎇

JUST (JST) formed bullish Gartley for upto 12% moveHi dear friends, hope you are well and welcome to the new trade setup of JUST ( JST ) token with BTC pair.
On a 4-hr time frame chart, JUST has formed a bullish harmonic Gartley pattern .
There is also a strong support at 0.00000113 btc .

JUST | Buy Or No-Buy? Up To 150% Potential ProfitsDefi is going bullish, the next pair to show this potential is JSTBTC; JUST.
Last week we had a strong high volume breakout to remove resistance.
After the initial jump, a retrace is normal to test the broken resistance level as support.
JSTBTC moved above EMA300 just to move back down below it a

$JST, Volume increasing and ~20% from the lows..$JST
Something to watch just in case it catches further traction from here..
Volume increasing and ~20% from the lows..
Still looking for HH/HL sequence to break from the descending trend
#JST

Just (JST)... What Else Do You Need? 200% MappedMy fellow trader, the Altcoins are looking good mid-, short- and long-term.
We have JSTBTC (Just) with higher lows short-term and long-term.
We also have a small and big widening ascending channels.
The RSI is now above 50 (51.35 to be exact).
And take a look at the MACD, this is what I call a "

JSTBTC is testing the weekly resistance JSTBTC is testing the weekly resistance inside a descending channel. IF the price will have a breakout from the channel and FLIP the weekly resistance into new support, According to Plancton's strategy (check our Academy), we can set a nice order
–––––
Follow the Shrimp 🦐
Keep in mind.
🟣 Purple
See all ideas
Summarizing what the indicators are suggesting.
Oscillators
Neutral
SellBuy
Strong sellStrong buy
Strong sellSellNeutralBuyStrong buy
Oscillators
Neutral
SellBuy
Strong sellStrong buy
Strong sellSellNeutralBuyStrong buy
Summary
Neutral
SellBuy
Strong sellStrong buy
Strong sellSellNeutralBuyStrong buy
Summary
Neutral
SellBuy
Strong sellStrong buy
Strong sellSellNeutralBuyStrong buy
Summary
Neutral
SellBuy
Strong sellStrong buy
Strong sellSellNeutralBuyStrong buy
Moving Averages
Neutral
SellBuy
Strong sellStrong buy
Strong sellSellNeutralBuyStrong buy
Moving Averages
Neutral
SellBuy
Strong sellStrong buy
Strong sellSellNeutralBuyStrong buy
Displays a symbol's price movements over previous years to identify recurring trends.