JUST | Long-Term Falling Wedge Leads To Long-Term GrowthGood day my fellow traders, can you feel it in the air?
Yes! If not, just take a look around this market; just take a look at the chart. JSTBTC, the JUST chart.
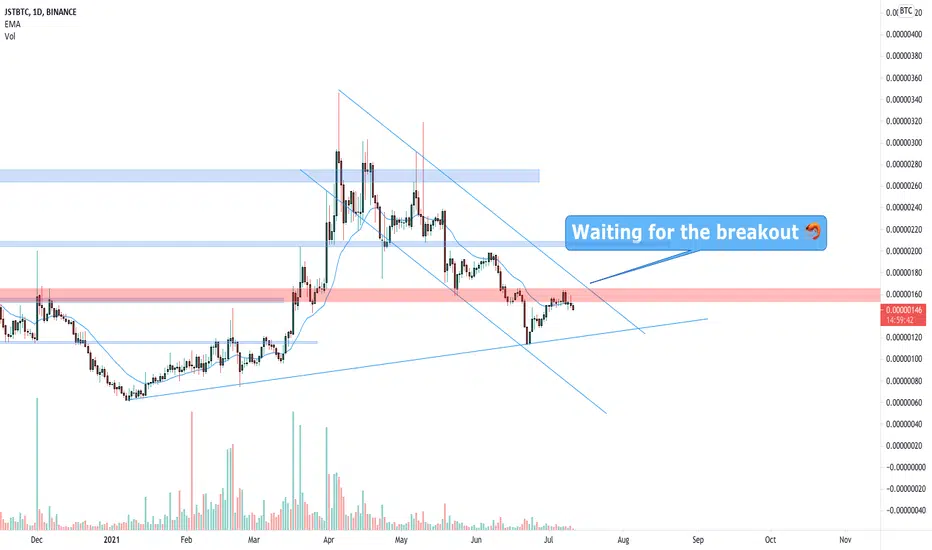
➢ Here we have a classic, ultra-accurate and long-term falling wedge pattern. This pattern is in the process of a bullish breakout based on short-term action related to the last two months.
➢ This pattern is valid since March/April 2021, so we are looking at 3.5 years prices moving down, thus, the reversal can be quite dramatic; high momentum filled bullish growth.
➢ We spot the chart and take action. We let the market take care of the rest. Remember, patience is key.
Thank you for your continued support.
You are appreciated.
Namaste.
JSTBTC trade ideas

JST R-Bott After BD-Channel Opens 333% BU-PotGood day my fellow traders, here we have one of the many altcoins that are going to grow really strong, and fast, while Bitcoin, Ethereum and the rest of the big altcoins continue to crash.
We are looking at Just vs Bitcoin — JSTBTC.
Let's keep it simple...
➖ We have a rounded bottom (R-Bott) after a major down-wave within a descending channel (BD-Channel).
With the market as it is, this pair is open for growth.
👉 We have a nice 333% bullish growth potential that can be achieved within months... or weeks.
Additional details can be found on the chart.
Thank you for reading.
For more altcoins, make sure to boost.
Thanks a lot for your support.
Namaste.

✳️ Just Early Bottom Signal (New All-Time High 19-33X Potential)Good day my fellow Cryptocurrency trader, let's get back to the charts.
My main interest are the ALTSBTC pairs, if these grow the USDT pairs will also grow so there's your answer.
If the ALTSUSDT pairs grow the ALTSBTC doesn't necessarily follow but it do works in reverse. So seeing this many ALTSBTC bullish means these projects are bullish in general.
➖ Just (JSTBTC) hit the lowest price last month since July 2020.
This month the pair is in the process of producing a higher low but still not confirmed. This is the "early bottom signal." The higher low can lead to a bullish wave.
Seeing that this pair has been in a downtrend since August 2020, the next bullish wave can be huge, even a new All-Time High is possible... Let's see some potential targets.
Warning: This is just speculation. We can predict a bullish breakout, a bullish wave or even an entire bullish cycle but a new ATH is yet to be seen... I am getting the feeling though that the timing is right and it can happen in 2024 or 2025.
Ok. Let's continue.
If a new ATH do show up, here are the potential targets:
1) 0.00001254 (1,865%)
2) 0.00002094 (3,185%)
Thank you for reading.
Your support is appreciated.
Namaste.


JST LONG TERM LOW RISK HIGH REWARD JST in weekly chart looking very Bullish. In coming weeks it will jit it's all time high 🎇

JUST (JST) formed bullish Gartley for upto 12% moveHi dear friends, hope you are well and welcome to the new trade setup of JUST ( JST ) token with BTC pair.
On a 4-hr time frame chart, JUST has formed a bullish harmonic Gartley pattern .
There is also a strong support at 0.00000113 btc .

JUST | Buy Or No-Buy? Up To 150% Potential ProfitsDefi is going bullish, the next pair to show this potential is JSTBTC; JUST.
Last week we had a strong high volume breakout to remove resistance.
After the initial jump, a retrace is normal to test the broken resistance level as support.
JSTBTC moved above EMA300 just to move back down below it and all the way down to EMA10.
We are having a bounce now... If the "support" level holds, we will see a strong bullish jump next.
Here is the trick, it can take several weeks, sometimes more, for the projected move to take place.
While sometimes it happens fast, other times we have to wait.
Patience is key to win.
Namaste.

$JST, Volume increasing and ~20% from the lows..$JST
Something to watch just in case it catches further traction from here..
Volume increasing and ~20% from the lows..
Still looking for HH/HL sequence to break from the descending trend
#JST

Just (JST)... What Else Do You Need? 200% MappedMy fellow trader, the Altcoins are looking good mid-, short- and long-term.
We have JSTBTC (Just) with higher lows short-term and long-term.
We also have a small and big widening ascending channels.
The RSI is now above 50 (51.35 to be exact).
And take a look at the MACD, this is what I call a "young bullish cross", because it is only starting to show up:
Here also we can notice the candles moving above EMA10 (green), EMA21 (light blue) and EMA50 (magenta)... This is all bullish.
What else do you need?
When you have me!
(Make sure to LIKE, comment and FOLLOW).
Thanks a lot for your continued support.
Namaste.

JSTBTC is testing the weekly resistance JSTBTC is testing the weekly resistance inside a descending channel. IF the price will have a breakout from the channel and FLIP the weekly resistance into new support, According to Plancton's strategy (check our Academy), we can set a nice order
–––––
Follow the Shrimp 🦐
Keep in mind.
🟣 Purple structure -> Monthly structure.
🔴 Red structure -> Weekly structure.
🔵 Blue structure -> Daily structure.
🟡 Yellow structure -> 4h structure.
⚫️ Black structure -> <4h structure.
Here is the Plancton0618 technical analysis, please comment below if you have any question.
The ENTRY in the market will be taken only if the condition of the Plancton0618 strategy will trigger.
JSTBTC - Long - Potential 13.53%JSTBTC - Long - Potential 13.53%
Exchanges: Binance
Signal Type: Regular (Long)
Entry Zone:
0.00000149 - 0.00000153
Take-Profit Targets:
1) 0.00000161
2) 0.00000174
Stop Targets:
1) 0.00000142
Entry Trigger- Dip buy, oversold RSI

Its a Good Buy Opportunity ❕ABC Correction Completed And Strong PRZ Zone Formed At 180 ,The Price Formed Bullish Pattern ,Its a Good Buy Opportunity
✅ Tp 1 : 280 (25%)
✅ Tp 2 : 345 (43%)
✅ Tp 3 : 400 (78%)
🔴 Stop loss zone : 180 ~ 175

jstusdt/1dayI'll be able to see nice arc for JST, so we're going to have approximately 155% rise after breakout above of its down trend.


JSTBTC continue upper movement
#Crypto_JSTBTC
JSTBTC continue upper movement running. Support area 0.00000220 JSTBTC.
My first target 0.00000350 & second target 0.00000500
Good chance for buying. Don't miss this chance.


Just Coin - JST It is just the beginningAll coins in the Tron (TRX) family is pumping up. After launching the SUN.io mining and Defi platform, looks like we are facing another Bullrun on the Tron environment.
Targets:
TP1: 0.00000374
TP2: 0.00000418
TP3: 0.00000538
TP4: 0.00000646
TP7: MOOOON
Don't consider it as financial advice!


JST can reach 350 satoshiJST breaks longterm descending trendline, but if it wants to climb satoshi walls, there is another trendline which should be broken.
If it breaks minor trendline, price can reach 190-260-350.
It is not an investment advice, I share my opinions.
Please trade at your own risk

