JTO — 1D Trend Breakout & MSS Hold1. Buy zone: 1.86–1.95 (hold above 1D S/R + MSS)
2. Entry: after trend breakout + MSS confirmation
3. Target: FVGs above, full tp 2.78
4. Stop: below 1.76
JTOUSDT trade ideas

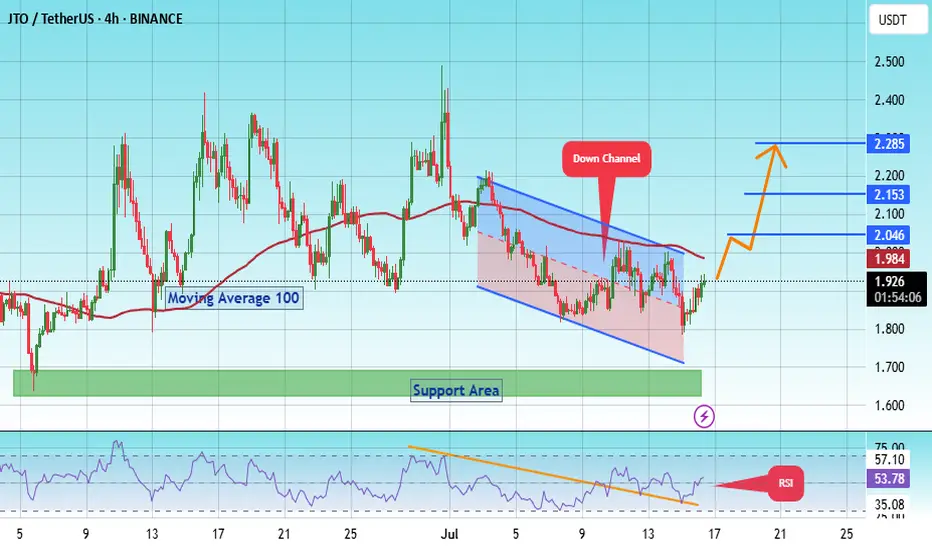
#JTO/USDT Forming Bullish Wave #JTO
The price is moving within a descending channel on the 1-hour frame, adhering well to it, and is on its way to breaking it strongly upwards and retesting it.
We have a bounce from the lower boundary of the descending channel. This support is at 1.73.
We have a downtrend on the RSI indicator that is about to be broken and retested, supporting the upside.
There is a major support area in green at 1.65, which represents a strong basis for the upside.
Don't forget a simple thing: ease and capital.
When you reach the first target, save some money and then change your stop-loss order to an entry order.
For inquiries, please leave a comment.
We have a trend to hold above the 100 Moving Average.
Entry price: 1.92.
First target: 2.046.
Second target: 2.15.
Third target: 2.28.
Don't forget a simple thing: ease and capital.
When you reach the first target, save some money and then change your stop-loss order to an entry order.
For inquiries, please leave a comment.
Thank you.
JTO : Price at a critical point: Falling or rising?Hello friends
Given the long-term range that this currency has made, the price has now reached the bottom of the range, which is very sensitive, and this currency also has a token release, which can be a warning.
In case of a drop, we have identified important supports for you, so that you can buy with risk and capital management.
*Trade safely with us*

#JTO/USDT#JTO
The price is moving within a descending channel on the 1-hour frame, adhering well to it, and is heading toward a strong breakout and retest.
We are experiencing a rebound from the lower boundary of the descending channel, which is support at 2.08.
We are experiencing a downtrend on the RSI indicator that is about to be broken and retested, supporting the upward trend.
We are heading toward stability above the 100 Moving Average.
Entry price: 2.136
First target: 2.22
Second target: 2.32
Third target: 2.40

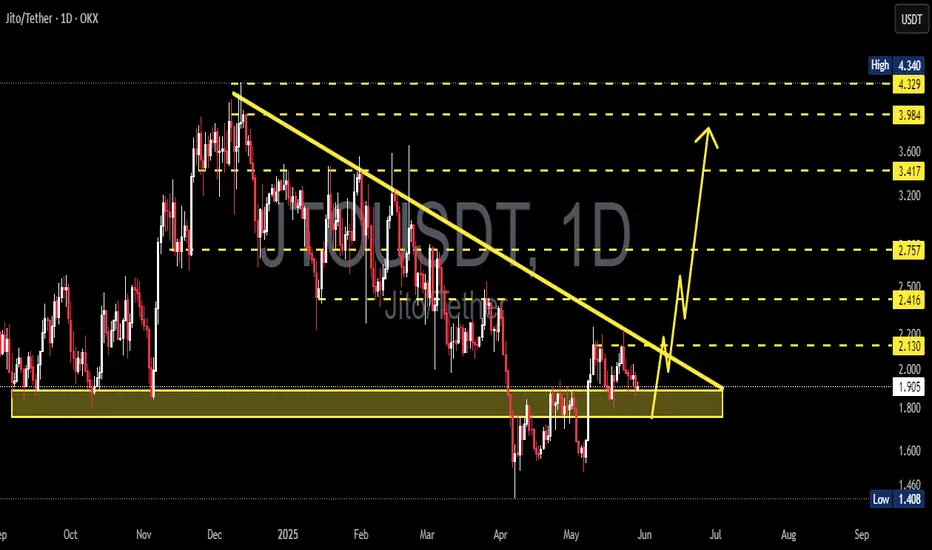
JTOUSDT Approaches Falling Wedge Breakout – Bullish Reversal?The chart indicates a major descending trendline resistance that has been tested multiple times since December 2024. Price action shows strong compression toward this resistance, suggesting a possible breakout moment.
🔄 Pattern Analysis: Falling Wedge
A Falling Wedge pattern is clearly visible:
This pattern typically signifies bullish reversal potential when formed in a downtrend.
Volume generally declines during the pattern and expands on the breakout.
The wedge begins around $3.97 and narrows down toward $2.18, where the current price action sits.
✅ Bullish Scenario:
If price breaks above the wedge resistance convincingly:
Breakout Confirmation Level: Around $2.42 (above the trendline and horizontal resistance)
Targets after breakout:
🎯 $2.73 – First major resistance
🎯 $3.39 – Mid-level resistance from previous structure
🎯 $3.97 – Key horizontal resistance and final wedge origin
🚀 Potential extension to $4.34 (previous swing high)
This would indicate a strong bullish trend resumption, especially if accompanied by high volume.
❌ Bearish Scenario:
If price fails to break above the wedge:
Possible rejection at $2.42, leading to:
🔻 Retest of support at $2.18
🔻 Further decline toward $1.40, the significant previous low
A breakdown below $2.18 would invalidate the wedge breakout and confirm bearish continuation.
⚠️ Key Technical Levels:
Support Zones: $2.18 – $1.40
Resistance Zones: $2.42 – $2.73 – $3.39 – $3.97 – $4.34
Pattern: Falling Wedge (Bullish Bias)
📌 Conclusion:
JTO/USDT is approaching a make-or-break zone. A successful breakout from the wedge could trigger a strong bullish rally, while failure may lead to further downside. Traders should monitor for volume confirmation on the breakout to validate direction.
#JTOUSDT #CryptoBreakout #FallingWedge #AltcoinAnalysis #CryptoTrading #BullishSetup #TechnicalAnalysis #ChartPattern #CryptoSignals

$JTO - Long SetupBINANCE:JTOUSDT | 3D
This one looks solid
If we can hold 2.12 to 2.04 , we can possibly retest 2.80 to $3
Stoploss just below 1.90
TPs:
2.44-2.52
2.78-3.07
3.30-3.56

JTOUSDT Forming Bullish BreakoutJTOUSDT is showing a promising bullish setup as it trades within a clear accumulation zone, suggesting that a major breakout could be on the horizon. The chart highlights strong support where price has bounced multiple times, forming a solid base for a potential upward move. With good volume confirming renewed buying interest, the stage looks set for an expected gain of 50% to 60%+ if momentum continues to build. This level of price action is attracting the attention of smart money investors who are positioning early for the next leg up.
The recent price behavior indicates that JTOUSDT is approaching a decisive breakout level. The market structure shows that sellers are losing control, while buyers are stepping in aggressively around key demand zones. As the broader crypto market sentiment improves, coins like JTO that have established a clear support zone can benefit from additional capital inflow, amplifying the breakout potential. Traders should watch for a strong daily close above the resistance area to confirm the trend reversal.
Technical traders are eyeing JTOUSDT as a strong contender for mid-term gains due to its favorable risk-to-reward ratio. With liquidity building up and higher lows forming, the setup aligns well with classic breakout trading strategies. The projected upside, if confirmed, aligns with similar moves seen in altcoins following consolidation phases, which makes this trade idea even more compelling.
Keep monitoring trading volume and candlestick patterns closely for the next few sessions. A confirmed move above the resistance could lead to a rapid price expansion, rewarding patient traders. Managing risk with clear stop-loss levels below the support zone will be key to maximizing profit potential while protecting capital.
✅ Show your support by hitting the like button and
✅ Leaving a comment below! (What is You opinion about this Coin)
Your feedback and engagement keep me inspired to share more insightful market analysis with you!

#JTO/USDT#JTO
The price is moving within a descending channel on the 1-hour frame and is expected to break and continue upward.
We have a trend to stabilize above the 100 moving average once again.
We have a downtrend on the RSI indicator that supports the upward move with a breakout.
We have a support area at the lower limit of the channel at 1.95, acting as strong support from which the price can rebound.
Entry price: 2.00
First target: 2.057
Second target: 2.11
Third target: 2.19

JTOUSDT Forming Bullish WaveJTOUSDT is currently shaping a promising bullish wave pattern, signaling potential continuation of an upward trend in the coming days or weeks. This wave formation is often associated with renewed buying interest and signals that price action is building strong momentum for another leg higher. Coupled with a steady increase in trading volume, the technical structure suggests that the asset may soon experience a substantial breakout. Based on historical wave behavior and key support/resistance levels, an expected gain of 50% to 60% appears realistic.
Market interest around JTO has been growing, with investors closely watching its price behavior as it consolidates above recent lows. This consolidation phase is often a prelude to significant rallies, especially when backed by solid wave structure and volume confirmation. As more liquidity enters the market, JTOUSDT is positioned to attract both swing traders and long-term holders seeking medium-risk, high-reward opportunities.
From a technical perspective, the coin is forming higher lows while testing critical resistance zones. If it manages to clear those levels with conviction, price targets could range between the upper Fibonacci extensions and prior distribution zones. The growing market chatter and improving sentiment around the JTO project further support the bullish thesis.
Keep an eye on upcoming market catalysts and macro trends, as they could amplify the bullish momentum already forming on the JTOUSDT chart. With a disciplined approach, this could become one of the standout performers in the mid-cap altcoin segment in the near term.
✅ Show your support by hitting the like button and
✅ Leaving a comment below! (What is You opinion about this Coin)
Your feedback and engagement keep me inspired to share more insightful market analysis with you!

JITO Long-Term Accumulation Phase, Whales, Exchanges & 500% PPThe same market conditions prevail on this chart as with many other altcoins. The low is in. The low has been in for months, since 7-April 2025.
The advance has been happening very slowly and this is good. There will be a point where everything is up "out of the blue." No blue here, no surprise. When you see everything goes up 300% or 500% in a matter of weeks, remember that first the market was sideways for months.
This sideways period is the consolidation-accumulation phase and this phase is when the bulls amass strength. Whales are loading. It takes a while because liquidity is not strong on these pairs so it takes months and months for the whales to be able to inject hundreds of millions into the market. If all the money was injected in a matter of days or weeks, it would be chaos, that's why it takes time for a bullish wave to develop.
This phase can last anywhere between 3-6 months. Some pairs already moved ahead and produced some growth. This growth is corrected, it is just like saying, "Hey calm down, not so fast..." And the exchanges put selling pressure on the market to reduce prices so the whales have more time to accumulate. Retail is always anxious, whales are always patient.
Accumulation can only go for so long. It is like a pressure cooker. Pressure builds up and boom! There needs to be a release, the release here is experienced as a very strong wave of growth.
To be honest, the story is irrelevant, only one thing is relevant if you are here for profits, to make money, to trade; Buy when prices are low and hold. Wait patiently for prices to grow. Sell when prices are high.
Only one thing matters, entry prices and timing.
If you get the right price and the right timing, you will do great. We are witnessing a long-term accumulation phase. It is reaching its end.
Cryptocurrency will grow.
The Altcoins will grow.
Bitcoin is already too strong.
Patience is key.
Thanks a lot for your continued support.
Namaste.

JTOUSDT Forming Symmetrical TriangleJTOUSDT has recently broken out of a well-defined symmetrical triangle pattern, signaling a potential bullish continuation. The breakout is backed by solid volume, indicating strong interest from market participants and confirming the breakout’s legitimacy. This technical setup often precedes a significant price rally, and with investor sentiment improving across altcoin markets, JTOUSDT could be set for a 60% to 70%+ move in the coming sessions.
The chart reveals that JTOUSDT has respected both trendlines over a prolonged period, forming a clear base and building momentum. Now that it has breached the resistance line, there is little overhead supply in the immediate region, which allows room for price expansion. This kind of breakout is typically seen in the early stages of a bullish cycle, often driven by new inflows and strong community backing.
Fundamentally, the project behind JTO continues to gain visibility, with increasing mentions across crypto forums and social media, suggesting that retail and institutional interest is growing. The token's liquidity is improving, and the breakout could attract momentum traders who were waiting for confirmation. If market sentiment remains favorable, the upside could be realized quicker than expected.
Traders and investors should monitor for a retest of the breakout level or continuation candles for a potential entry point. Given the confluence of technical strength and increasing attention on the project, JTOUSDT stands as a promising candidate for short-to-mid-term bullish opportunities.
✅ Show your support by hitting the like button and
✅ Leaving a comment below! (What is You opinion about this Coin)
Your feedback and engagement keep me inspired to share more insightful market analysis with you!

Can JTO pull a BNB All-Time-High Move??BNB made a similar pattern that led to it's previous ATH.
Since we are still waiting on the new ETH a time highs, followed by altseason, we can expect to see altcoins beginning to increase when ETH trades sideways. More on that here :
We can also expect to see rallies across other altcoins:
and
But before we see a glorious altseason, ETH needs to start moving to the upside as a starting point.
_______________
BINANCE:JTOUSDT
BINANCE:BNBUSDT

JTOUSDT 1D AnalysisJTO ~ 1D Analysis
#JTO Buy gradually from here if you still have confidence in this coin with a short term target of at least 15%+ from here.
JTOUSDT 1D#JTO has formed a Falling Wedge pattern on the daily chart — a classic bullish setup. 📉➡️📈
📍 Consider buying near the support levels:
$1.823 and $1.703
In case of a breakout above the wedge resistance and the daily EMA100, the upside targets are:
🎯 $2.255
🎯 $2.527
🎯 $2.874
🎯 $3.220
🎯 $3.712
⚠️ Always use a tight stop-loss to protect your capital.

JTO will pump 20%JTO is building value above the pmProfile. That´s bullish and not bearish, because people are accepting the price above the profile. This "building value" tells us that the price is preparing for another leg to the upside -> We have to find out main targets above the current range. There are some untapped levels like the pwPOC and pwVAH above 2.300. They are in confluence with the bullish sequence target zone. That´s why I am planning to sell off at the upper pwPOC. What´s the invalidation? When do we need to exit the trade? Only if JTO starts to build a lot of value below the pmVAH and even pmPOC. That´s something we would need to observe during many 4 hr candles. It isn´t likely to happen. Especially because we can see long-liquidations (b-pattern) based on the pwProfile. The market is too short to substantially go lower. This information combined with the value that is building above the pmProfile, will lead to higher prices. We have bought JTO multiple times in the past days and sold off at pwVAHs. It made sense because price likes to came back to the good entry zone multiple times, for example because market makers are forcing long liquidations first. (b-pattern).

JTO Approaching Breakout Point – Watch This Wedge!🚀 JTO Falling wedge Formation – 100%+ Potential Incoming?! 👀🔥
Hey Traders! If you're all about high-conviction plays and real alpha, smash that 👍 and tap Follow for more setups that actually deliver! 💹💯
JTO has been consolidating within a falling wedge on the daily timeframe for months and is now approaching the apex of the structure.
The price has shown strong demand around the $1.85–$2.00 support zone and is now attempting to push above the wedge resistance trendline.
Technical Highlights:
Falling wedge formation, typically a bullish pattern
Support holding firm at the $2.00 psychological level
Potential for a breakout retest and continuation if volume confirms
Trade Setup
Entry: CMP and add more in the green box(up to $1.8)
Targets: $2.48 / $2.84 / $3.30
Stop Loss: Below $1.85
Risk-to-Reward: Well-structured setup with defined invalidation
A confirmed breakout from this structure could open the door for a strong upside move. Keep an eye on volume and market momentum for confirmation.
What do you think about this? Share your views in the comment section.

JTO Buy/Long Setup (1D)It appears that JTO is in a bearish pattern on the higher timeframe, but it shows a bullish structure on the lower timeframes and could move to the upside.
The trigger line has been broken, and we have a bullish CH (Change of Character) on the chart.
We are looking for buy/long positions around the SWAP zone.
A daily candle closing below the invalidation level would invalidate this outlook.
For risk management, please don't forget stop loss and capital management
When we reach the first target, save some profit and then change the stop to entry
Comment if you have any questions
Thank You

JTOUSDT 12% PROFIT DONE.JTOUSDT chart was shared few days ago with perfect entry zones, price came in the zone and did 12% pump.

JTO TRADE IDEAJTOUSDT is currently trading at previous day high after bullish CHoCH, I will look for long below previous day liquidity and FVG. DCA zone for cautions also marked.

AMKTcryptomarket | JTOUSDTHello to all AMKT friends, I hope you are well. 😍
Today we will review the JTO token.
In the monthly and weekly timeframes, this token is in a range (minor trend) after the sharp rise, and the failure of this range box along with the increase in volume can cause amazing growth of this token.
In the daily timeframe, we are involved in the white dynamic resistance level, and in the four-hour timeframe, we can enter a long position after the failure and consolidation above 1.899 and the dynamic level. For further confirmation, we can wait for an increase in volume or a break of 60.08 in RSI
Have a good day

The long liquidations depleted the market of selling potentialJTO looked terrible for a looong time. Now the market is way too short on it, which is visible in all the b-shaped profiles. That means we had very aggressive sellers that forced the price to the downside to liquidate the longs. Once that is completed, it leaves the market without underlying selling potential. So the aggressive sellers will become the victim, as they are acting against the long-term buyers which are currently accumulating.
As the pmProfiles (previous month profiles) give us our main targets, the upper b-shaped pmProfile needs to get re-inspected. The pmPOC becomes target number 1.
"Long liquidation depletes the market of
selling potential, which will often set the stage for a meaningful rally that
carries price substantially beyond the levels that triggered the liquidation
in the first place."
That´s why I think bulls have a very good chance to even run for the pmVAH above 2.5$.
I bought some JTO here, might buy a bit lower if the price goes a bit lower once again. Looking for the pmPOC as TP1 and pmVAH as TP2.

JTO bullish scenarioJTO price moving in this macro bull flag.
Price has tested the lowest support and now showing bullish price action no low timeframes.
Going with a hypothesis that price has now started a bullish trend, mapping out potential pathway aligning to fib levels and fib time and projecting a breakout from the flag with ultimate target close to $7.

#JTO/USDT#JTO
The price is moving within a descending channel on the 1-hour frame, adhering well to it, and is heading for a strong breakout and retest.
We are seeing a bounce from the lower boundary of the descending channel, which is support at 1.57.
We have a downtrend on the RSI indicator that is about to break and retest, supporting the upward trend.
We are looking for stability above the 100 moving average.
Entry price: 1.60
First target: 1.64
Second target: 1.70
Third target: 1.76
