JTOUSDT Falling Wedge Breakout!JTOUSDT Technical analysis update
JTO has formed a falling wedge pattern and the price is currently breaking through the resistance line. This could signal a potential upward movement in JTO.
Buy zone : Below $2.05
Stop loss : $1.89
Regards
Hexa
JTOUSDT trade ideas

JTO THE DREAM BREAKThanks for reading this update.
JTO seems to make new price action for a new break.
Soon more.

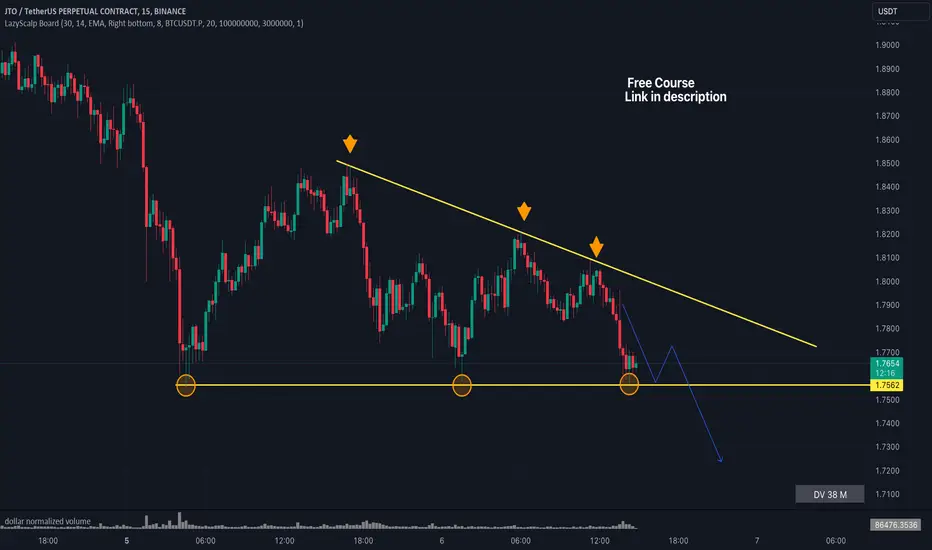
#JTOUSDT Breakout of the $1.7562 price level SHORT #JTOUSDT from $1.7562
5m TF.
The instrument has formed a local downtrend with a decrease in trading volumes and price maxima along the trend line, which may indicate a manifestation of weakness by buyers. The compression goes to the support level with a few clear touches, followed by the feet of long participants.
I will wait for consolidation near the level and an increase in activity in the glass before the breakdown.

JTOUSDT in downtrend and their is no divergence in H1 JTOUSDT in downtrend and their is no divergence in H1
so we can trade on instant short and SL above the previous LH and so on

Jito JTOJito is a sol native staking protocol
Very early in its first cycle
If you compare it to the main curve bottom structure I've been highlighting for sui and others
It appears to be slightly early in the same cycle
Yet to break downtrend and re-accumulate..
I'll be looking to pick some up in the blue box somewhere as a solana bluechip ecosystem coin
Still thinking solana has a very strong cycle here
Incredible volume on nfts and dex's
Phantom app overtaking coinbase app in total downloads
Theres a few other metrics that support solana having a very strong cycle beyond strong price action
Anyways due this this we can be bullish on early solana ecosystem coins I think..
Jupiter (wen?) Like tomorrow
Margin fi
And I'm sure more will pop up ...

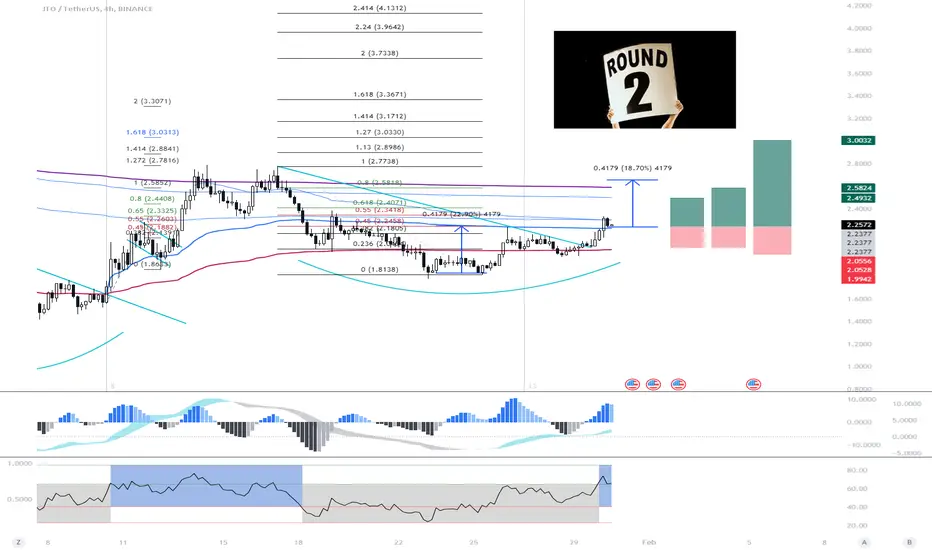
JTO/USDT - round 2!!BINANCE:JTOUSDT peaked at the VWAP anchored to initial listing and fell below the one anchored to the last sell off of the prior consolidation. It has just completed a brief consolidation, breaking above the VWAP anchored to the prior breakout.
This opens the opportunity to retest the VWAP from initial listing before climbing higher. I plan to play this by taking profit at the VWAP from the last failed attempt, again at the VWAP from listing, and then edge up stops as it makes a higher high. A move below ~1.95-1.97 would invalidate.
JTO - 1D - $7,50 - Increase of approx. 240% possible - Double B.JTO is coming out a Double Bottom and can go straight to $7,50 which is an increase of approx. 240%.


#JTO may continue to fall according to the double top structure🧠We encountered resistance at the resistance area after a period of rebound and formed a double top short structure, so there is a high probability that we will continue to decline.📉
⚠️Note that if the short defense point is breached, then the bearish view becomes invalid
🤜If you like my analysis, please like 💖and share it💬
💕 Follow me so you don't miss out on any signals and analyze 💯

JTO/USDTAfter we make a nice Expansion Price Retracement to the consolidation zone.
Expecting price to continue Higher To target BSL


I'm More Bullish Than Bearish On JTO!!JTO is trading in a bullish pattern. The falling wedge has a higher probaability of breaking to the upside. If we get a nice breakout to the upside, I would be looking to target the POC above around $2.90.
If we fail this support level, the next level below is around $2.105. there we have major confluence, which is the .886, .382, & Daily level. If that is reached and holds, I would consider entering a long position.
We don't know how price will play out so we manage our risk accordingly.
i]Calculate Your Risk/Reward so you don't lose more than 1% of your account per trade.
Every day the charts provide new information. You have to adjust or get REKT.
Love it or hate it, hit that thumbs up and share your thoughts below!
This is not financial advice. This is for educational purposes only.

JITO - 12hrs ( Easy 25 X in 2024 Bull Run ) 💵Pair Name : Jito
Time Frame : 4hrs Chart / Close
Scale Type : Large Scale
------
🌐 spreading knowledge among us and to clarify the most important points of entry, exit and entry with more than 5 reasons
We seek to spread understanding rather than make money
🔗 Key Technical / Direction ( Long )
Type : Mid Term Swing
——————————
First Target Area : 5 $ all Time High
only 2 X From Now Price
Bull Run End For Investor Target
50 $
25 X Full Target Range

JITO - 4hrs ( Up + 57 % - Bull Run Target 3000 % ) 💵Pair Name : Jito
Time Frame : 4hrs Chart / Close
Scale Type : Large Scale
------
🌐 spreading knowledge among us and to clarify the most important points of entry, exit and entry with more than 5 reasons
We seek to spread understanding rather than make money
🔗 Key Technical / Direction ( Long )
Type : Mid Term Swing
——————————
🔥 Price Up + 57 %
Our First Target At 5 $ = 185 % Growth
Our 2nd Target At 50 $ = 3000 % Growth
in next Bull Run / After Halving Event

JTO Unlocking Potential: The Perfect Entry Point for Profits 💰**JTO Coin: Fundamental Analysis**
JTO is the governance token of the Jito ecosystem, a decentralized finance (DeFi) platform built on the Solana blockchain. Jito allows users to stake Solana (SOL) and earn rewards in the form of jitoSOL, a liquid staking token. JTO holders also have voting rights on the future direction of the Jito platform.
**Fundamental Strengths**
* **Solana Ecosystem:** Jito is built on the Solana blockchain, which is known for its high scalability and low transaction fees. This makes Jito a compelling option for DeFi users who want to avoid the congestion and high fees that plague many other blockchains.
* **Liquid Staking:** Jito's liquid staking feature allows users to stake their SOL and still earn rewards while being able to trade or lend their SOL. This is a major advantage over traditional staking, which requires users to lock up their SOL and wait for a period of time before they can access their rewards.
* **Community Governance:** JTO holders have voting rights on the future direction of the Jito platform. This gives JTO holders a say in how the project is developed and how its resources are allocated.
**Recent News**
* **Jito Airdrop:** Jito has been conducting a series of airdrops to reward early adopters and users of the platform. These airdrops have generated a lot of interest in JTO and have helped to boost the token's price.
* **Exchange Listings:** Jito has been listed on several major cryptocurrency exchanges, including Binance and Coinbase. This has made it easier for investors to buy and sell JTO, which has further increased the token's popularity.
* **Technical Development:** The Jito team is actively developing new features for the platform, such as a decentralized exchange (DEX) and a lending market. These new features are expected to attract more users to the platform and drive further adoption of JTO.
**Disclaimer**
Please note that this is not financial advice. The cryptocurrency market is volatile and risky, and there is no guarantee that JTO will increase in value. Always do your own research before investing in any cryptocurrency.

How bullish is JTO?According to the ascending structure and breakout of Trend Line and Bullish CH on the chart, JTO can go up.
Serious supplies are TP 1 and TP 2. For rebuy, the green range is suitable.
Closing 1 daily candle below the green range will violate the analysis
For risk management, please don't forget stop loss and capital management
When we reach the first target, save some profit and then change the stop to entry
Comment if you have any questions
Thank You

JTOUSDT LONGLONG POSITION
Signal Validity: 2D
Order Price: 2.26
TP: 4.83
SL: 1.28
Margin: 2% of the capital
Risk/Reward Ratio: 2.61
CROSS 2X
Pay attention to the validity time of the signal from the time of publication. After the end of credit, if the order is not activated, delete the order.
See the results on the channel.

JTOUSDTJTOUSDT is one of the best looking crypto currency for 2024 with over 3300% of bullish movement to come


#JTOIn the H1 period, a motivational wave has been created, which with the formation of a lower floor and a correction, now has the ability to touch the specified targets. For a buy position, wait until you break the bearish trigger and then enter the buy transaction.
