Jup going for 2 digits!Jup never have any weekly candle close below the C.E of the Weekly fvg/BISI.
●Which is a bullish sign for Jupiter.
●Buy Some at CMP.
●What is we get a dump and Jup keep going down, then buy Jup with heavy amount in 0.7350$ to 0.6486$ range.
But I don't think we'll get that dip, but if we got one then it may be a quick wick.
●Jup cab easily trade near 10$ .
JUPUSDT trade ideas

$JUP #Jupiter Trading IdeaJUP/USD (Jupiter) confirmed that it formed a rising wedge pattern. Waiting for a clean breakout. My price target after a clean breakout would be $1.21; $1.39, etc. those massive supply zones IYKYK.

JUP BREAK THE ZONE.JUP seems to have entered a new level of break, and there is a good chance this coin can keep the increase. we will follow new trends for confirmations.

$JUPjup looks like its finding its bottom and ready for next leg up, depend on how the market behaves jup could be good entry here.

#JUP/USDT is forming a Triangle in 4-Hour TF!#JUP/USDT is forming a Triangle in 4-Hour TF!
LSE:JUP needs to hold the bottom trendline as a support. #JUPUSDT needs to break PDH $1.015 resistance level to gain the bullish momentum.
$JUP #Jupiter Trading IdeaJUP/USD (Jupiter) might be gearing up for a potential rise. On a higher timeframe, it has formed a potential falling wedge pattern.
However, as illustrated in my analysis, we could still see a lower price. The next support zone is around $0.7218. Keep an eye on this setup.


#JUP/USDT SPOT LONG ENTRYBINANCE:JUPUSDT
#JUP/USDT SPOT LONG ENTRY
Leverage: 1x
Entries: $1.8397
Take profit 1: $1.3659
Take profit 2: $1.4888
Take profit 3: $1.7814
Stop Loss: $0.9893
NOTE: This is just my prediction. Be sure to use STOPLOSS and remember that I am not a financial adviser. your money, your risk!
Thanks
The sroced.

JUP | Back in Trading RangeI like Jupiter here; it has reclaimed its trading range and is above both the daily MA-50 and the daily MA-10. Be careful with position sizing, as the market in general still looks a bit weak.


JUPUSDT.PHello Trader BINANCE:JUPUSDT.P
Adam Eve chart, still sideways retest area 1.1785 - 1.1381. take a limit or market price order
take profit 31%
stop loss 5%
Please add a comment and Positive feedback and constructive criticism are important to authors and the community.
Disclamer: Not Financial Advice

JUP target $184h time frame
-
JUP has dipped over 50% since hitting $1.8, accompanying with silent alts on Solana. From TA, JUP makes a healthy retracemetn that could be seen as a correction wave of Elliott impulse wave, which means there is a further pump while JUP continues to match the Elliott wave trend. Moreover, once alts season starts, JUP could gain huge profit from those trading on Solana, it will be a positive assistance for consistent pump until JUP reaches a reasonable market cap.
-
Bull target: $18~$20

Adding to my JUP airdrop bagAdding to my JUP airdrop bag here at 0.966 after taking profits around 1.6 a few weeks ago.
Sitting at its macro golden pocket fib and holding it well.
I will add at 0.813 & 0.6675 if we get it but wouldn’t be surprised if this thing bottoms around here as I’m bullish SOL with our recent buys.

JupiterPrice has retraced to the Fib Golden Pocket and with moon phase bullish shift in less than 5 days this represents a good entry for swing traders.

Jupiter JUP price is hovering over the abyssIf the Head and Shoulders pattern is completed on the #JUPUSDT chart (and the falling trading volumes from left to right hint at this), then the target for developing this pattern will be in the range of $0.87 - 0.92 per LSE:JUP
And it can be even safer and more profitable for your deposit if you leave pending limit orders to buy the #Jupiter token at $0.67-0.68
Of course, if you believe in this project and want to invest in it.
_____________________
Did you like our analysis? Leave a comment, like, and follow to get more

JUP/USDT Ready to Reclaim its Position Back? 👀🚀JUP Analysis 💎Paradisers, #JUPUSDT has just grazed the bottom of its ascending channel, setting the stage for a potential climb. Keep your eyes peeled for an upward trajectory as #Jupiter seeks higher grounds.
💎If the price of #JUP struggles to maintain its footing at the channel's lower boundary, we anticipate a bullish pivot from the support at $0.691. This level is primed with rich liquidity, previously sparking significant upward movements with robust green candles.
💎If #JUP dips below this key support, we're looking at a possible bullish bounce from the even lower demand zone at $0.46. Failing to hold this level could lead to enhanced selling pressure.
💎Staying alert and adaptable is crucial as we navigate the evolving dynamics of the #Jupiter market. Keep your strategy flexible and your observations sharp, Paradisers. We're here to help you ride the waves of these market movements.

LONG #JUPUSDTLONG #JUPUSDT from $1.3834
15m TF. The instrument has formed a cascade of several resistance levels, behind each of which I expect to see unrealized liquidity. Active compression, consolidating new lows and local spikes in long volumes indicate the interest of buyers in updating the highs.
I am considering consolidating and increasing the speed of the tape in the glass before the breakdown of each of the levels.

Short Time Jup Why Notİ think its look good short setup for general.%5 stop if it past last high it remain bullish this bet looking good.Also decline in general daily.Also for long term best buy range is 0.87-0.9$

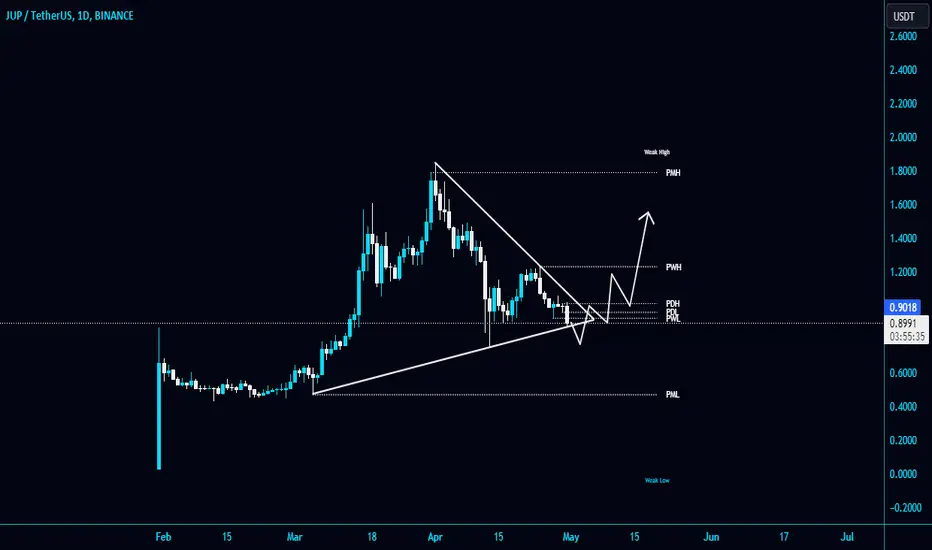
End of the triangle break to upside again?What’s your take ladies and gents. Looking bullish but cautious at the same time.

$JUP 1$ PlanI'm back at LSE:JUP with a large back SPOT ONLY.
This project have a huge potential, you can be bullish on CRYPTOCAP:SOL and bearish on $JUP.
Let's do some math
CRYPTOCAP:ETH ATH Market Cap was 575B$ While CRYPTOCAP:UNI was 24B$, that's 4.2%
Let's take that to CRYPTOCAP:SOL , let's say CRYPTOCAP:SOL will reach 300$ in the bull market.
CRYPTOCAP:SOL at 300$ will take the Market cap to 130B$, at this level LSE:JUP should be at 5.2B$
That's a 4$ for $JUP.
This is not a FA, the math is just for fun.

JUP Strong coinJupiter coin is looking really strong. It's definitely a good coin to hold in the bag. I expect a continuation of the pump, considering it's moving on support and it's not following the BTC weakness. My first target is the resistance zone at $2.3

JUP/USDT Break Alert! Show a retest is valid and continue upward💎 Paradisers, #JUP has recently undergone significant market dynamics, successfully breaking out of the ascending triangle pattern.
💎 Following the breakout, JUP has undergone a retesting phase on the support level, which previously acted as resistance. This retest signifies potential strength in the newfound bullish momentum, with JUP poised for continued upward movement toward our target area.
💎 However, should JUP fail to sustain its upward climb and retreat towards the support area, it would be crucial to monitor its behavior closely. While a bounce from the support level could signal resilience and a potential resumption of the uptrend, a breakdown below this level could indicate a false breakout scenario.
💎 In the event of a breakdown, where JUP breaches the support level, caution is warranted as it may suggest weakening bullish momentum.

Jup/Usdt Plan The bullish flag breakout for JUP/USDT has been confirmed. Currently, the price is retesting the breakout zone. If the retest is successful, I am expecting a good 20-30% bullish move in the short term.
Please note that this is not financial advice. Do your own research (DYOR) before making any investment decisions.
