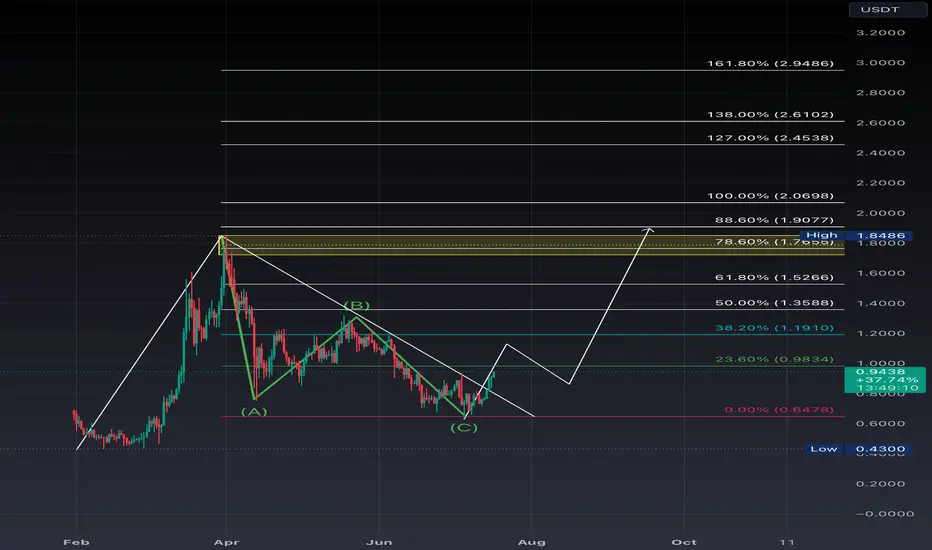
Can $JUP Pull a $UNI RunAs I shared before I was aggressively buying JUP at 0.4$ levels and I'm still holding.
You can start accumulating anything below 1.5$ as in the chart.
My final target is 4.89$ as in the chart (X10 from my entry), I believe JUP will go higher than that because 👇
If we compare JUP to UNI.
Jupiter current trading volume is higher than UNI's average trading volume in 2021.
The hype surrounding Solana in 2024 is similar to the hype surrounding Ethereum in 2021.
PLEASE DYOR AND THIS IS NOT A FA.
JUPUSDT trade ideas

Jupiter on course to new ATHs in the near futureThere's many signs that suggest a major trend reversal:
1) Double bottom
2) Previous resistance line acted as support for the previous 2 lows, extremely precisely as well
3) Lower 0.618 St. Deviation Band of the all time VWAP acted as a support again
4) Bullish divergence on volume weighted RSI 4H
5) Price broke through the resistance line and just got retested, this also aligns with the 0.236 Fib extension level
Fundamentals are great as well. Nearly half the volume on Solana comes from the Jupiter aggregator. JUP is one of the most held tokens on the network. The team is very active with updates and fixes. A 30% supply burn is planned.
TP targets are the 1.618 of the Fib extension (which happens to be just above ATH) and $2.
I think JUP has the potential to go much higher, but there's likely to be a pullback if these levels are reached, which would be an opportunity to re-enter.
If we go down from here it remains bullish as long as price doesn't go below the first green zone, if it does I would expect a further drop to the second zone.

JUP - FEBRUARY SURPRISE - $3.00+Here is my plan for JUPITER
Huge support area where we are now. FIBS LOOKING GREAT. RESPECTFUL.
No brainer holding from here. Great area to load up.
Active staking rewards, use the platform, etc.
#Altseason is coming hope you are ready.

JUP. 0.8925. LONGThe token is at a key level. The buyer holds the price. There is a large accumulation and a breakout base, which can give a good impulse to long.

JUPUSDT Bullish Long Daily TimeFrameJUPUSDT has been consolidating in the area between the 0,73-0,78, trying to break the resistance that is seating in the 0,8 level.Today, we got the confirmation on the MACD, in the Daily Timeframe, with the signal line being crossed. On the way down, JUP left an area that was not tested between the 0,9-0,95 that could lead the bulls wanting to test that price area. On the way, we expect some strong resistance levels seating on the levels of the 0,84 and 0,9. And if we manage to hold this levels, there is still potential to hit the 1usdt and more. Huge potential trade with low risk considering the market sentiment shit.

$JUP to + $1.00posted an expanded flat idea earlier saying that either:
a) bottom for LSE:JUP is in
or
b) bottom soon (expanded flat means leg 'c' can retrace past 'a'
i think we have finally terminated 'c'.
fib extension of wave 1 to 2 shows that leg 3 can potentially be as high as + $1.00
break above the parallel upper band would give me confirmation that wave 3 is confirmed.

$JUP local bottom; $1.20 is next target.looks like we are in a corrective wave 2, which to me seems to be an expanded flat correction. we can see 'b' pass the origin price corrective wave 2. 'c' is either completed and we rally to $1.20 (fib extension from wave 1 to 2), or 'c' is currently being terminated and we should locally bottom here soon.

Jupiter Main Downtrend Channel JUPJup price using this channel since its all-time-high. Recently price using mid line of the channel as resistance.
If the price can surpass that mid line with $0.835 - $0.84 breakout it will continue to follow white uptrend channel and will want to go to the top line of channel.
If it continue to fail to break there, it will want to go to the bottom line of the channel.
Currently it's rejecting and let's see what will happen.

JUP looks bearish (12H)From where we put the red arrow on the chart, it looks like a correction pattern has started.
According to the price and time rules, it seems that this pattern is a diametric.
It seems that the d wave of this diametric is over now.
The targets are marked on the chart.
Closing a daily candle above the invalidation level will violate the analysis.
For risk management, please don't forget stop loss and capital management
When we reach the first target, save some profit and then change the stop to entry
Comment if you have any questions
Thank You

Jupiter - Bulls dominating!Jupiter broke the downtrend line initiated on April 1, making a bullish divergence in the RSI on the daily time frame and piercing the MAs with some bullish strength.
Jupiter has immense potential, and I believe in US$ 1.30 in the short term, and US$ 1.80+ in the medium term, I will update the analysis over time.

Short position on JUPUSDT 49Min/ Trading setupBINANCE:JUPUSDT
BITSTAMP:JUPUSD
SL2 ---- Mid-risk status: 4x-5x Leverage
SL1 ---- Low-risk status: 2x-3x Leverage
⚡️TP:
1.075
1.068
1.055
1.045
1.035
1.025
1.012
0.989(In Optimistic Scenario)
➡️SL:
1.186
1.144
The Alternate scenario:
If the price stabilize above the trigger zone, and stabilize above resistance line, the setup will be cancelled.

JUP/USDT Looking Good To Enter!After creating a wick downward retesting the dynamic and horizontal structure on the daily timeframe, JUP/USDT is looking very bullish! I'm expecting a possible bullish engulfing candle today and continuation to the upside.
If you are looking to enter JUP in a spot position, this is a good time to do so as I believe we might see a new all-time high (ATH) in the coming months!

#JUP/USDT#JUP
The price is moving in a descending channel on the 4-hour frame and we are about to break it
We have a bounce from a major support area in green at 0.600
We have a downtrend on the RSI indicator that has been broken upwards
We have a trend to stabilize above the moving average 100 which supports the rise
Entry price 1.10
First target 1.28
Second target 1.52
Third target 1.80

#Jup 1D chartLSE:JUP 1D chart;
Although it seems to have broken the downtrend, OB resistance will most likely work.
The bearish pattern is active unless the Stop level just above the OB resistance is seen.
Within this pattern, a 30% decline in the first stage would not be a surprise. ⏳

JUP is stuck in a downward channelJUP is stuck in a downward channel and nowadays is challenging the middle line. I predict some days of fluctuation around the line and turns it a support dynamic line. Touching the bottom line of channel seems far from my prediction.

Will JUPUSDT Continue Its Bullish Reversal or Face a Downturn?Yello, Paradisers! Is #JUPUSDT poised for a bullish breakout, or are we heading towards a significant retest and possible downturn? Let’s dive in!
💎#JUP has shown a promising sign of a bullish reversal by breaking out of the descending resistance. However, the current price appears to be facing resistance, suggesting a potential retest at the support level of 0.872 before attempting another breakout to hit our target area.
💎If JUP manages to break through the resistance without retesting the support first, the likelihood of an upward movement and continuation of the bullish trend increases significantly.
💎On the downside, if JUP fails to bounce when retesting the support area, the price might revisit the strong demand zone. Historically, JUP has consistently rebounded from this zone, but failure to sustain the strong demand area around 0.68 could invalidate the bullish outlook. This would indicate a bearish trend, with the price potentially moving further downward and dipping.
Treat the market as a businessman, not as a gambler.
MyCryptoParadise
iFeel the success🌴

Jup Breaking Out For Upside Continuation Jup Preparing For Further Upside Bullish Rally
Trend Is already Up And Now Breaking Bullish consolidation Breaking Falling Wedge And Crucial Horizontal Resistance At The Same Time Incase Of Successful Breakout Expecting Solid Recovery In Coming days
Successful Breakout Can Lead Solid Bullish Wave Towards 2$ In Coming Days

JUPUSDT Bullish Wedge Pattern!JUPUSDT Technical analysis update
JUP price broke the falling wedge pattern on the daily chart. The price could retest the previous support before going up.
Buy level: Above $0.90
Stop Loss: $.79
Regards
Hexa

JUP to test its highAs we can see on 1D charts here, the correction legs + timing looks pretty good.. my expect targets 1.9-2.9$ #NFA
Trade Setup: JUP Long PositionMarket Context:
JUP is showing signs of a trend reversal, reclaiming a key area as support with a notable spike in volume. The 4-hour chart indicates a shift in structure with a higher high, suggesting a potential uptrend.
Trade Setup:
Entry: Ladder into a buy around the $0.8 zone.
Take Profit:
First target: $1.1
Second target: $1.3
Third target: $1.4
Stop Loss: Place the stop loss at a daily close below $0.7.
📊 Monitor for any pullbacks into the buy zone and adjust your entry accordingly! #JUP #CryptoTrading #TrendReversal 🎯

Jupiter Crypto Price Prediction: JUP Could Fall to $0.7 SoonBINANCE:JUPUSDT slid more than 2% in the past 24 hours to trade at $0.7598 at press time.
Despite the recent retracement, the JUP price is still over 3% in the green on the weekly timeframe.
The Jupiter crypto price is testing the key support level at $0.7580. Should the altcoin fall below this critical price point, it could be at risk of plummeting to the subsequent support at $0.7. Conversely, JUP closing the next two 4-hour candles above $0.7580 might invalidate the bearish thesis. In this alternative scenario, the crypto could rise to as high as $0.83.
Technical indicators on JUP’s 4-hour chart warn that the Jupiter crypto price could drop in the coming 24 hours. More specifically, the Moving Average Convergence Divergence (MACD), Relative Strength Index (RSI) and Exponential Moving Average (EMAs) are showing bearish signs.
Throughout the past day of trading, the RSI dropped below its Simple Moving Average (SMA) line to signal that sellers gained the upper hand against buyers on the 4-hour chart. Should bears decide to capitalize on this advantage, it might be easier for sellers to pull the Jupiter crypto price down in the next 24 hours than it will be for buyers to push it up.
Meanwhile, the MACD line is on the verge of breaking down below the MACD Signal line. These two lines intersecting in the next 12 hours will result in a major bearish technical flag being triggered. Traders might also see this as an indication that JUP has entered a negative short-term phase.
Concurrently, the 9 EMA is collapsing in on the 20 EMA, which could be a sign that momentum over the past nine 4-hour candles has been more bearish than the momentum over the last twenty candles. If the 9 EMA crosses under the 20 EMA, it could signal a negative shift in JUP’s price action.

JUP is about to fly nowJupiter #JUP LSE:JUP looks poised to start a rally again
Bullish divergence + 0.786 Fibonacci Level

BUYING JUP HERE WITH EASY INVALIDATION!!Hey everyone!
If you're enjoying this analysis, a thumbs up and follow would be greatly appreciated!
JUP looks good here. Forming a falling wedge-like structure in the daily time frame and holding the support (Green box) very well so far and bouncing from here. Buy some here and add more in the dip.
Entry range:- $0.64-$0.74
Targets:- $0.86/$1.02/$1.38/$1.62
SL:- Daily close below $0.62
