#KAITOUSDT Trade Setup
📌 Coin: KAITO (Kaito AI)
💰 Buy Levels:
✅ Accumulation Zone: $1.6178 – $1.7490
🧠 Fundamental Analysis (FA) – In Short
*️⃣ Sector: Artificial Intelligence / Web3 Search Engine
*️⃣ Use Case: Kaito is building an AI-powered search engine for Web3 data, aiming to index blockchain content (tweets, research, news, protocols, token data) into an intelligent, searchable interface.
*️⃣ Tech: Combines large language models (LLMs) with on-chain and off-chain datasets. Focused on real-time, multi-modal Web3 knowledge access and discovery tools.
*️⃣ Product Suite: Includes the Kaito AI Chatbot, Crypto Search, and Alpha Feed, tailored for researchers, traders, and analysts.
*️⃣ Adoption: Early traction among pro users and analysts. Interface comparable to Bloomberg Terminal for crypto insights.
*️⃣ Investors: Backed by top VCs like Dragonfly, Sequoia Capital, and Superscrypt.
*️⃣ Narrative Fit: Positioned as a Web3 version of Google Search, enhanced by AI. High appeal during AI + crypto convergence narrative.
🎯 Bull Market Target (Realistic)
Target Range: $3.00 – $4.50
*️⃣ Based on utility growth, user traction in research platforms, and increased demand for on-chain intelligence.
🚀 Mega Bullish Target (Speculative Top)
Target Range: $7.00 – $10.00+
*️⃣ If Kaito becomes the go-to AI gateway for Web3 data and secures major integrations with CEXs, dApps, or L2 ecosystems.
✅ Final Take
🧠 KAITO is an AI+Web3 data play with real product differentiation, targeting serious users and information flow in a fragmented crypto space.
Your entries fall near post-launch consolidation range, ideal if accumulation sustains and AI narratives resurface.
#KAITOUSDT
Buy : - 1.61782500 - 1.74900000
Target 1: 1.88017500
Target 2: 2.01135000
Target 3: 2.27370000
Target 4: 2.90334000
Stop-Loss: 1.31515125
Risk/Reward: 20.00% / 66.00%
R:R = 2:1
ROI: 30.00%
Risk Percentage / Position size:1%
Duration:45 - 90 Days
Confidence in Trade: Mid
we ask Allah reconcile and repay.
KAITOUSDT trade ideas
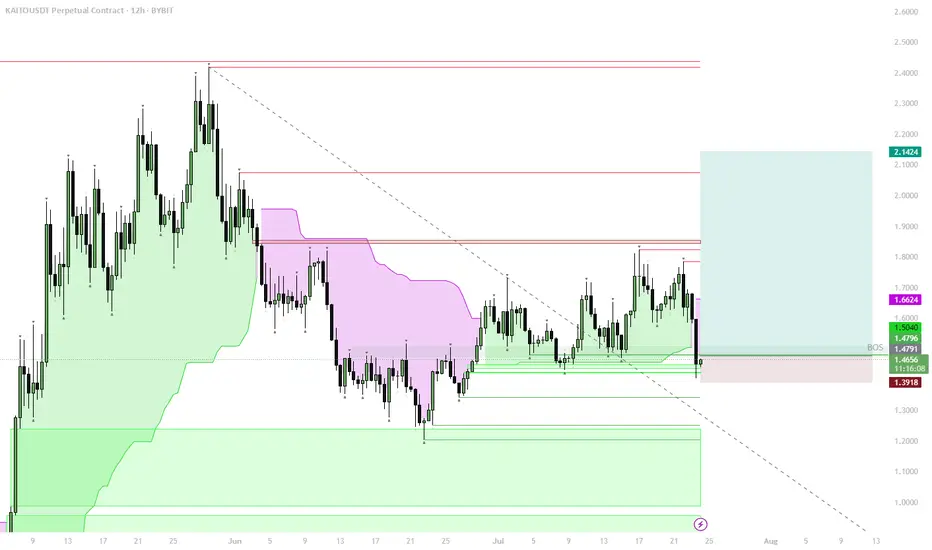
KAITO – Structural Flip, Bullish Accumulation ZoneStructural Shift:
Price reclaimed the key 1D S/R + BOS (Break of Structure) level, signaling a major trend change from bearish to bullish.
Trend Confirmation:
The move above $1.48–$1.50 zone confirms a bullish market structure. This level is now strong support.
Accumulation Opportunity:
The area between $1.65–$1.50 is ideal for spot accumulation, as it aligns with the reclaimed BOS and the lower edge of the bullish structure.
Upside Targets:
If the bullish structure holds, price could target $1.66 (local resistance), with the next targets at $1.85, $2.14, and potentially higher if momentum continues.
Invalidation:
A break and close below $1.48 would invalidate this bullish scenario and signal a return to the previous range.
The reclaim of the BOS level, with a shift above 1D S/R, marks a clear bullish structural flip on the chart. Historically, such shifts create strong accumulation zones just above the reclaimed level, where risk/reward is best for spot buys. Buying into the $1.65–$1.50 range aligns with both trend-following and classic Smart Money concepts: enter after the structural confirmation, not before. Invalidation is clear below $1.48, where structure would flip bearish again.
#Kaito Yapping for kaito here. Daily TF looks alright, if we start pushing hard here we might push for more!!!
On weekly it's trading inside a ascending triangle & with the way market is have feeling we might push up BUT risking only 3% here ;)

Kaito Long Kaito appears to be lagging behind. However sentiment is showing over 80% is short on the 1hr chart and 61% is short on the 12hr time frame. We will look for a contrarian view to look for long set ups.

KAITO | High MindshareKAITO presents a compelling bullish setup as social media attention drives renewed interest in this token. The chart shows a textbook bounce from the ascending trendline support around $1.25, with price now testing the upper consolidation zone.
**Key Technical Points:**
• Clean bounce off multi-month ascending trendline
• RSI recovering from oversold conditions
• Breaking above immediate resistance levels
• Social media buzz providing fundamental catalyst
**Trade Setup:**
• **Entry**: Golden box zone (slight pullback from current levels)
• **Target**: Upper green resistance zone around $1.42-$1.48
• **Stop Loss**: Below $1.20 (trendline violation)
**Risk Management:**
The ascending trendline acts as critical support - any close below $1.20 would invalidate the bullish case. Social media hype can be volatile, so position sizing should account for potential quick reversals. Volume confirmation on any breakout above the consolidation zone would strengthen the bullish thesis significantly.

Bullish continuationPrice has consolidating above the 200 SMA and the consolidation seems to continue above support.
My target is 1.5840
SL is 1.3850

Signals Are Lining Up for a KAITO Breakout! Key Levels to WatchYello, Paradisers! Are you watching what just happened with #KAITO? Because this could be the early phase of a massive reversal after weeks of correction, and the risk-reward setup is getting too attractive to ignore…
💎After a strong bullish rally, KAITO entered a classic falling wedge correction, a bullish continuation pattern. Now, the price is approaching critical levels and beginning to show signs of strength, printing a bullish divergence on the RSI.
💎Recently, KAITO tested a major support zone between $1.200 and $1.250, and reacted positively. Even more promising, price action is shaping a potential morning star pattern, a powerful reversal signal, right at this demand zone.
💎#KAITOUSDT looks primed to retest the falling wedge resistance at $1.40. This is the first big hurdle, and if bulls manage to hold strength, price could quickly see momentum push price towards $1.60–$1.70, a heavy resistance area where aggressive profit-taking is expected.
💎If the wedge breakout confirms, the broader structure suggests that KAITO has the potential to run all the way to $2.00–$2.10. That’s not just a psychological level, it also marks the pattern target and aligns with the 50% Fibonacci retracement of the prior downtrend.
Paradisers, strive for consistency, not quick profits. Treat the market as a businessman, not as a gambler.
MyCryptoParadise
iFeel the success🌴

KAITOUSDT Perpetual – Breakout Anticipation Long SetupKAITOUSDT is showing early signs of a potential breakout after a tight consolidation range, with price action stabilizing above the key zone at $1.3776. This setup aims to capture the next impulsive leg upward.
Trade Details:
Position: Long
Entry: $1.3776
Stop Loss: $1.3020
Take Profit: $1.5891
Setup Type: Pre-breakout Accumulation / Range Expansion
Setup Rationale:
Market has been ranging tightly with decreasing volatility
Bullish momentum likely to follow upon break of local resistance
Risk is minimized with stop just below the range low
High reward potential if price targets previous resistance above $1.58
This is a classic volatility squeeze setup where a sudden expansion to the upside is expected after prolonged sideways action.

KAITO/USDTKey Level Zone: 1.7060 - 1.7240
LMT v1.0 detected.
The setup looks promising—price previously trended upward with rising volume and momentum, then retested this zone cleanly. This presents an excellent reward-to-risk opportunity if momentum continues to align.
Introducing LMT (Levels & Momentum Trading)
- Over the past 3 years, I’ve refined my approach to focus more sharply on the single most important element in any trade: the KEY LEVEL.
- While HMT (High Momentum Trading) served me well—combining trend, momentum, volume, and structure across multiple timeframes—I realized that consistently identifying and respecting these critical price zones is what truly separates good trades from great ones.
- That insight led to the evolution of HMT into LMT – Levels & Momentum Trading.
Why the Change? (From HMT to LMT)
Switching from High Momentum Trading (HMT) to Levels & Momentum Trading (LMT) improves precision, risk control, and confidence by:
- Clearer Entries & Stops: Defined key levels make it easier to plan entries, stop-losses, and position sizing—no more guesswork.
- Better Signal Quality: Momentum is now always checked against a support or resistance zone—if it aligns, it's a stronger setup.
- Improved Reward-to-Risk: All trades are anchored to key levels, making it easier to calculate and manage risk effectively.
- Stronger Confidence: With clear invalidation points beyond key levels, it's easier to trust the plan and stay disciplined—even in tough markets.
Whenever I share a signal, it’s because:
- A high‐probability key level has been identified on a higher timeframe.
- Lower‐timeframe momentum, market structure and volume suggest continuation or reversal is imminent.
- The reward‐to‐risk (based on that key level) meets my criteria for a disciplined entry.
***Please note that conducting a comprehensive analysis on a single timeframe chart can be quite challenging and sometimes confusing. I appreciate your understanding of the effort involved.
Important Note: The Role of Key Levels
- Holding a key level zone: If price respects the key level zone, momentum often carries the trend in the expected direction. That’s when we look to enter, with stop-loss placed just beyond the zone with some buffer.
- Breaking a key level zone: A definitive break signals a potential stop‐out for trend traders. For reversal traders, it’s a cue to consider switching direction—price often retests broken zones as new support or resistance.
My Trading Rules (Unchanged)
Risk Management
- Maximum risk per trade: 2.5%
- Leverage: 5x
Exit Strategy / Profit Taking
- Sell at least 70% on the 3rd wave up (LTF Wave 5).
- Typically sell 50% during a high‐volume spike.
- Move stop‐loss to breakeven once the trade achieves a 1.5:1 R:R.
- Exit at breakeven if momentum fades or divergence appears.
The market is highly dynamic and constantly changing. LMT signals and target profit (TP) levels are based on the current price and movement, but market conditions can shift instantly, so it is crucial to remain adaptable and follow the market's movement.
If you find this signal/analysis meaningful, kindly like and share it.
Thank you for your support~
Sharing this with love!
From HMT to LMT: A Brief Version History
HM Signal :
Date: 17/08/2023
- Early concept identifying high momentum pullbacks within strong uptrends
- Triggered after a prior wave up with rising volume and momentum
- Focused on healthy retracements into support for optimal reward-to-risk setups
HMT v1.0:
Date: 18/10/2024
- Initial release of the High Momentum Trading framework
- Combined multi-timeframe trend, volume, and momentum analysis.
- Focused on identifying strong trending moves high momentum
HMT v2.0:
Date: 17/12/2024
- Major update to the Momentum indicator
- Reduced false signals from inaccurate momentum detection
- New screener with improved accuracy and fewer signals
HMT v3.0:
Date: 23/12/2024
- Added liquidity factor to enhance trend continuation
- Improved potential for momentum-based plays
- Increased winning probability by reducing entries during peaks
HMT v3.1:
Date: 31/12/2024
- Enhanced entry confirmation for improved reward-to-risk ratios
HMT v4.0:
Date: 05/01/2025
- Incorporated buying and selling pressure in lower timeframes to enhance the probability of trending moves while optimizing entry timing and scaling
HMT v4.1:
Date: 06/01/2025
- Enhanced take-profit (TP) target by incorporating market structure analysis
HMT v5 :
Date: 23/01/2025
- Refined wave analysis for trending conditions
- Incorporated lower timeframe (LTF) momentum to strengthen trend reliability
- Re-aligned and re-balanced entry conditions for improved accuracy
HMT v6 :
Date : 15/02/2025
- Integrated strong accumulation activity into in-depth wave analysis
HMT v7 :
Date : 20/03/2025
- Refined wave analysis along with accumulation and market sentiment
HMT v8 :
Date : 16/04/2025
- Fully restructured strategy logic
HMT v8.1 :
Date : 18/04/2025
- Refined Take Profit (TP) logic to be more conservative for improved win consistency
LMT v1.0 :
Date : 06/06/2025
- Rebranded to emphasize key levels + momentum as the core framework

KAITO/USDT / TECHNICAL ANALYSIS (15 MIN CHART)The chart shows a Descending Channel structure which has been broken with strong bullish momentum. a potential reversal in play.
📈 TRADE PLAN:
🔹 Entry: 1.7907 (after confirmation on retest)
🔹 Stop Loss (SL): 1.6909 (below recent support)
🔹 Target: (Based on next key resistance zone – you may set manually or use trailing TP depending on market strength)
🧠 Strategy:
Wait for a proper retest of the broken trendline (support now) and confirm entry with bullish candlestick structure. Risk should be managed strictly with SL placement just below support.
Opportunities don’t happen. You create them." – Chris Grosser

KAITO | waiting for FVG sweep$KAITO
Failed to reclaim monthly resistance, drifting down.
Eyes on $1.77–1.58 for bounce, but main long setup is $1.30–1.20 (1D FVG cluster).
Momentum fading — waiting for liquidity flush.
Break below $0.88 — bulls out.
Watching for SFP or reversal in main zones before entering.
📌 Patience required — wait for a proper sweep and confirmation before acting. Strong setups form when fear peaks.

KAITO/USDT – Brewing a Trend Reversal?
After a prolonged downtrend and flat consolidation, KAITO is showing its first real signs of bullish momentum. Price has now broken above the EMA 4 (0.8937) and is hovering around $1.14, challenging a descending trendline resistance.
📊 Key Technical Highlights:
RSI at 63.54: Momentum is picking up, entering bullish territory but not yet overheated.
Strong move today with increasing volume suggests buyers are stepping in.
Price reclaiming the 0.236 Fib level ($1.1960), a potential signal of retracement towards deeper fib levels.
🎯 Upside Targets (Fibonacci-based):
TP1: $1.60 (0.618 retracement) – initial strong resistance.
TP2: $2.12 – a key liquidity and fib cluster zone (blue box), ideal profit zone for short-term bulls.
TP3: $3.33 – ambitious mid-term target, could be triggered on broader altcoin strength.
🔑 Entry Zones:
Aggressive: Current price area around $1.14 (momentum breakout).
Pullback Entry: $1.06–$1.08 zone for a possible retest of support.
✅ Validation & Risk:
Setup remains valid as long as it holds above $1.06 (last local low).
Invalidation below $0.89 (EMA 4) would indicate a failed breakout and continuation of bearish pressure.
📌 Bonus Note: There’s a clear break in market structure and volume is ticking up — keep an eye on follow-through. If it reclaims the 200MA (green) convincingly, this could trigger a longer-term trend shift.
What do you think about it?
Good trading!

KAITO PERPETUAL TRADE ,Bought From $1.87KAITO PERPETUAL TRADE
KAITO BUY SETUP
Currently $1.87
Bought From $1.87
(Trading plan If KAITO go down to $1.75
will add more longs)
Expecting target $1.94 OR ABOVE
Incase of early exist will update this anaylsis
Its not a Financial advice

Buy Trade Strategy for KAITO: AI-Powered Web3 Search InnovationDescription:
This trading idea is based on KAITO, a forward-thinking project merging artificial intelligence with Web3 search functionality. KAITO aims to redefine how users access and navigate blockchain data by providing an AI-enhanced search engine specifically designed for the decentralized internet. With the rising demand for structured, intelligent access to fragmented crypto content, KAITO fills a critical gap in the market. Its fundamentals are rooted in strong technological vision, a skilled development team, and increasing interest from institutional and retail sectors in AI-powered blockchain tools.
As the Web3 ecosystem continues to evolve, projects like KAITO that improve accessibility and usability are positioned for significant long-term value. Still, it's important to acknowledge the risks involved. Crypto assets are inherently volatile, and their prices can be impacted by market sentiment, regulatory changes, or shifts in tech trends.
Disclaimer:
This trading idea is provided solely for educational purposes and should not be considered financial advice. Investing in cryptocurrencies like KAITO involves substantial risks, including the potential loss of your entire capital. Always conduct your own research, assess your financial condition, and seek guidance from a qualified advisor before making any investment decisions. Past performance does not guarantee future outcomes.

KAITO/USDTKey Level Zone: 1.8180 - 1.8550
HMT v8.1 detected. The setup looks promising, supported by a previous upward/downward trend with increasing volume and momentum, presenting an excellent reward-to-risk opportunity.
HMT (High Momentum Trending):
HMT is based on trend, momentum, volume, and market structure across multiple timeframes. It highlights setups with strong potential for upward movement and higher rewards.
Whenever I spot a signal for my own trading, I’ll share it. Please note that conducting a comprehensive analysis on a single timeframe chart can be quite challenging and sometimes confusing. I appreciate your understanding of the effort involved.
Important Note :
Role of Key Levels:
- These zones are critical for analyzing price trends. If the key level zone holds, the price may continue trending in the expected direction. However, momentum may increase or decrease based on subsequent patterns.
- Breakouts: If the key level zone breaks, it signals a stop-out. For reversal traders, this presents an opportunity to consider switching direction, as the price often retests these zones, which may act as strong support-turned-resistance (or vice versa).
My Trading Rules
Risk Management
- Maximum risk per trade: 2.5%.
- Leverage: 5x.
Exit Strategy
Profit-Taking:
- Sell at least 70% on the 3rd wave up (LTF Wave 5).
- Typically, sell 50% during a high-volume spike.
- Adjust stop-loss to breakeven once the trade achieves a 1.5:1 reward-to-risk ratio.
- If the market shows signs of losing momentum or divergence, ill will exit at breakeven.
The market is highly dynamic and constantly changing. HMT signals and target profit (TP) levels are based on the current price and movement, but market conditions can shift instantly, so it is crucial to remain adaptable and follow the market's movement.
If you find this signal/analysis meaningful, kindly like and share it.
Thank you for your support~
Sharing this with love!
HMT v2.0:
- Major update to the Momentum indicator
- Reduced false signals from inaccurate momentum detection
- New screener with improved accuracy and fewer signals
HMT v3.0:
- Added liquidity factor to enhance trend continuation
- Improved potential for momentum-based plays
- Increased winning probability by reducing entries during peaks
HMT v3.1:
- Enhanced entry confirmation for improved reward-to-risk ratios
HMT v4.0:
- Incorporated buying and selling pressure in lower timeframes to enhance the probability of trending moves while optimizing entry timing and scaling
HMT v4.1:
- Enhanced take-profit (TP) target by incorporating market structure analysis
HMT v5 :
Date: 23/01/2025
- Refined wave analysis for trending conditions
- Incorporated lower timeframe (LTF) momentum to strengthen trend reliability
- Re-aligned and re-balanced entry conditions for improved accuracy
HMT v6 :
Date : 15/02/2025
- Integrated strong accumulation activity into in-depth wave analysis
HMT v7 :
Date : 20/03/2025
- Refined wave analysis along with accumulation and market sentiment
HMT v8 :
Date : 16/04/2025
- Fully restructured strategy logic
HMT v8.1 :
Date : 18/04/2025
- Refined Take Profit (TP) logic to be more conservative for improved win consistency

KAITO PERPETUAL TRADE , KAITO SELL SETUPKAITO PERPETUAL TRADE
KAITO SELL SETUP
Currently $2.05
Sold From $2.05
(Trading plan If KAITO go up to $2.20
will add more shorts)
Expecting target $1.93 OR DOWN
Incase of early exist will update this anaylsis
Its not a Financial advice

Long Trade Setup – KAITOUSDT.P!📈
Timeframe: 30-Minute Chart
Pattern: Bullish descending triangle breakout
📌 Trade Plan
Entry Zone: Around $1.7062 (breakout confirmation)
Stop-Loss (SL): Below $1.6143 (previous swing low)
🎯 Take Profit Targets
TP1: $1.8226 – Previous resistance
TP2: $1.9655 – Pattern breakout projection
🔍 Technical Highlights
Breakout from descending triangle on rising trendline
Bullish candle with volume confirmation
Tight consolidation near breakout = ideal setup
📊 Risk-Reward Calculation
Risk: $1.7062 - $1.6143 = $0.0919
Reward to TP2: $1.9655 - $1.7062 = $0.2593
R:R Ratio ≈ 1:2.82
🚨 Execution Strategy
Enter above yellow zone after confirmed breakout
SL below trendline (white)
TP1 partial booking, let rest ride to TP2

Kaito continued upward movement.
anticipated to function as a significant support level. This area represents prior selling pressure that has been overcome and is likely to attract buying interest on any retracements. The primary objective for this bullish advance is the buyside liquidity situated above the current price.

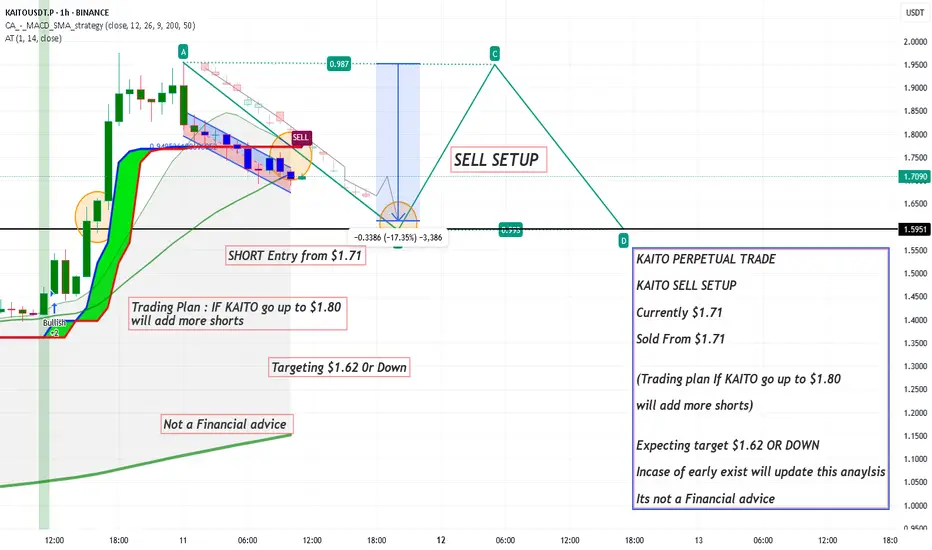
KAITO PERPETUAL TRADE ,Sold From $1.71KAITO PERPETUAL TRADE
KAITO SELL SETUP
Currently $1.71
Sold From $1.71
(Trading plan If KAITO go up to $1.80
will add more shorts)
Expecting target $1.62 OR DOWN
Incase of early exist will update this anaylsis
Its not a Financial advice
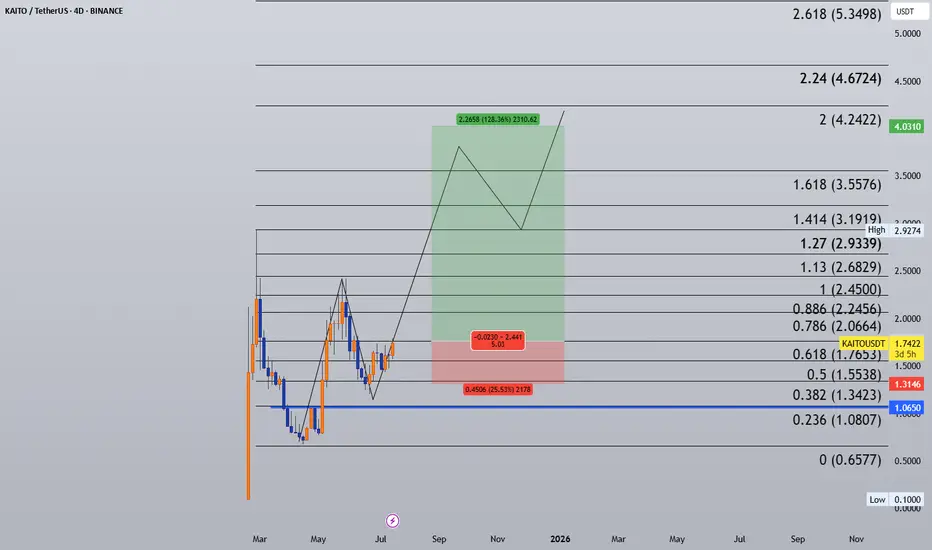
Kaito: Easy Short-Term Trade Setup (PP: 130%)This is an easy trade setup. It is a short-term trade-idea based on the daily KAITOUSDT chart.
The chart bullish signals consist of: (1) A broken downtrend, (2) a rounded bottom and low 7-April and (3) a higher low 4-May.
After this combination of signals, today we have a full green candle and bullish wave. The higher low coupled with this candle is the continuation of the bullish move that started after the April low. Seeing that the downtrend has been broken, we can expect higher prices in the weeks and months to come.
The target on the chart is an easy target, it can go much higher of course.
Thanks a lot for your continued support.
This is how an easy trade setup looks like. Easy to spot, easy to buy easy to hold.
Namaste.


Phemex Analysis #79: KAITO Surge 85% in 48 Hours!KAITO token has recently experienced a significant surge, gaining approximately 85% in the past 48 hours. This explosive price action has drawn considerable attention from traders and investors. The surge appears to be fueled by increased investor interest driven by new partnerships and expanding community rewards, particularly the integration of Huma Finance's Yapper leaderboard. Kaito is an AI token based on the BASE blockchain. The platform aims to enhance user experience and engagement within decentralized finance (DeFi) by providing AI-driven insights. This analysis will delve into the potential reasons behind this surge and explore possible trading scenarios for KAITO.
Possible Reasons
The recent price surge in KAITO can be attributed to a combination of factors:
Huma Finance Integration: KAITO's integration of Huma Finance's Yapper leaderboard has generated excitement. Yappers, who actively engage with crypto-related content on X, are being rewarded through Kaito's platform. This collaboration is likely driving increased demand for KAITO tokens.
"Earn and Drop" Season: Kaito founder Yu Hu announced the start of the "Earn and Drop" season, with collaborations like the one with PayFi Network's BOOP. These initiatives incentivize user participation and can contribute to positive price momentum.
Increased Transparency: The addition of Total Value Distributed data to Kaito's Dune Analytics dashboard provides greater transparency into reward distribution within the ecosystem. This transparency can boost investor confidence.
Community Growth: Kaito has experienced strong community growth, with a significant number of monthly active "Yappers." A vibrant and engaged community can contribute to increased token demand.
Token Withdrawals from Exchanges: Data indicates that investors have been withdrawing KAITO tokens from exchanges, suggesting accumulation rather than selling pressure.
Possible Scenarios
Given the recent surge, here are three potential scenarios for KAITO's short-term price action:
1. Continuation of the Uptrend
If KAITO maintains strong buying pressure, high volume, and positive sentiment driven by ongoing developments and community engagement, the uptrend could continue.
Pro Tips:
If the price continues rising, consider taking short-term profits at key resistance levels like $1.78, $2.02 & $2.43.
Monitor technical indicators such as the Relative Strength Index (RSI) and Moving Average Convergence Divergence (MACD) for confirmation of continued bullish momentum.
2. Bearish Reversal
Following the rapid price increase, KAITO is vulnerable to a bearish reversal. Profit-taking, negative news, or a shift in overall market sentiment could trigger a significant decline.
Pro Tips:
Watch for signs of weakening momentum, such as bearish divergence in the RSI or the formation of bearish chart patterns (e.g., double top, head and shoulders).
Be prepared to exit long positions quickly if a reversal occurs.
Consider short-selling opportunities if the price breaks below key support levels with strong volume, but exercise caution and manage risk effectively.
3. Small Dip Before Continued Rise
KAITO's price may experience a small dip, potentially towards the $1.00 level, followed by a consolidation period before resuming its upward trajectory. This scenario suggests a temporary pullback before the uptrend continues.
Pro Tips:
Identify the potential support level for the dip (e.g., $1.00).
Watch for signs of consolidation following the dip, such as sideways price action with decreasing volatility.
You might start accumulating KAITO during the sideways movement or look for a breakout above the consolidation range as a signal to enter long positions, targeting the previous resistance levels.
Conclusion
KAITO's recent 85% surge is driven by a combination of factors, including strategic integrations, community engagement, and positive market sentiment. While the current momentum is strong, traders should be aware of the inherent volatility in the cryptocurrency market. The three scenarios outlined above—continuation of the uptrend, bearish reversal, and a small dip before a continued rise—provide a framework for understanding potential future price action. By employing sound risk management practices, utilizing technical and fundamental analysis, and staying informed about developments within the Kaito ecosystem, traders can navigate the market effectively.
Pro Tips:
Trade Smarter, Not Harder with Phemex. Benefit from cutting-edge features like multiple watchlists, basket orders, and real-time strategy adjustments. Our unique scaled order system and iceberg order functionality give you a competitive edge.
Disclaimer: This is NOT financial or investment advice. Please conduct your own research (DYOR). Phemex is not responsible, directly or indirectly, for any damage or loss incurred or claimed to be caused by or in association with the use of or reliance on any content, goods, or services mentioned in this article.

Kaito surge as usualYou can clearly see how our Fbuy caught Kaito surge very early. A good volume and a Fbuy signal is always something big. What happened with Meme is also happening with Kaito. We are expecting 1.77 to 1.99 level before that exhaustion phase
For Indicator access, you can drop a message
DYOR
