Bearish outlook: rising wedgeChart description:
Upcoming short idea requires confirmation;
Rising wedge, ending diagonal;
Distribution schematic;
KASUSD trade ideas

KASUSD - Bull Continuation Nice curved trend that i think price will break out of and move high
Daily chart
A Very bullish coin

KAS LongYup, it's that time again...to take stupid profits from KASPA. Bullish to 0.21 or 0.24 from 0.14 - 0.17. Neutral on fear & Greed, not yet overbought on MACD. Staying in channel well and looking bullish!

Kaspa potential breakout to above orange line; 4 hrly chart.2nd bullish divergence marker on the 4 hourly timeframe had appeared. Is Kaspa on the verge of breaking out above the short term green trendline?
If Kaspa successfully breaks out and then manages to retest ATH at ca. 20 cents, finding support above the orange long-term trendline, then it would have a chance to make its way towards above $1.
See the previously published full long-term trend lines here below.

KASPA key trendlines..These are the two key trendlines that I am presently monitoring on the weekly.
For Kaspa to hit above 1 USD, it will first have to pierce and find support above the orange line, before making its way towards the yellow line.

Kaspa: Bull Flag, waiting for the next leg up.Accumulation of KAS from BTC and ETH completed.
Presently seeing a bull flag setup on the hourly timeframe.
Expecting KAS to perhaps retest the golden pocket ~61.8-65% Fib retrace lvl, before breaking above the blue resistance line..

Waiting to convert some ETH into KAS.Will consider to start DCAing from ETH into KAS above the orange 200 SMA level, down to the golden pocket (65%-61.8% Fib Retrace lvl).

KASPA ON THE MOVE
Pattern: Falling Wedge
A falling wedge pattern is forming, generally considered a bullish reversal pattern. It indicates that, while the price is trending downward within the wedge, a breakout to the upside could be expected upon completion of the pattern.
Support and Resistance:
Support: The lower green line represents the wedge's support. The recent price action shows the price is bouncing off this line.
Resistance: The upper green line signifies the wedge’s resistance. Breaking above this line would confirm a bullish breakout.
Technical Indicators:
RSI (Relative Strength Index):
Current level is around 48.23, moving towards the 50 mark, indicating a neutral zone. If RSI continues upward, it could indicate increased buying momentum.
Stochastic Oscillator:
Stochastic shows oversold conditions and appears to be curling up from the low, indicating a potential bullish crossover. A crossover in oversold territory generally signals a reversal.
VMC Cipher B:
Shows a mix of divergences and momentum shifts. The current configuration indicates building momentum, but a confirmation signal for reversal is ideal.
HMA+ Histogram:
Slight bearish pressure but shows signs of weakening, possibly hinting at an upcoming shift.
Price Targets:
Immediate Target upon Breakout: If the price breaks out of the wedge pattern, it could reach resistance levels around $0.1500 - $0.1600.
Long-term Target: Should the breakout sustain and momentum continues, KAS could reach $0.1800 or higher, as marked on the chart.
Risk Management:
Stop-Loss: Place a stop-loss slightly below the wedge’s support line (around $0.1300) to limit potential downside in case of a breakdown.
Take Profit Levels:
First Take-Profit: $0.1500 (first resistance zone)
Second Take-Profit: $0.1600 (next major resistance)
Final Take-Profit: $0.1800 for the long-term.
Trading Plan:
Entry:
Wait for a confirmation breakout above the resistance line of the wedge (around $0.1380). Confirm with increased volume if possible.
Exit:
Exit at predefined take-profit levels, adjusting stops to breakeven or above after the first take-profit level is reached to protect gains.
Alternative Plan:
If KAS fails to break out and breaks below the support level, reconsider the trade and look for further downside indicators.

KASPA - TRADE PLAN + TECHNICAL ANALYSISTechnical analysis + trading plan for Kaspa (KAS/USD), assuming a bullish continuation pattern as the symmetrical triangle indicates.
Pattern:
The price is forming a bullish symmetrical triangle, generally seen as a continuation pattern in an uptrend.
Current Price:
$0.15529, with the price consolidating within a triangle pattern.
Resistance and Support:
The top line of the triangle represents resistance, while the bottom line is support. The price is expected to break above resistance if the bullish momentum continues.
Indicators:
RSI (Relative Strength Index): RSI is high, around 76.8, indicating overbought conditions. This could mean a temporary pullback before a breakout.
Stochastic Oscillator: It is also in an overbought range, signaling that caution is needed, as the price may consolidate further.
VMC Cipher B Divergence: Suggests bullish divergence with a momentum shift, supportive of a potential breakout.
HMA Histogram: Shows slight bearish momentum, which may indicate a minor pullback before the breakout.
Trading Plan
Entry Strategy:
Breakout Confirmation: Enter a long position if there’s a confirmed breakout above the resistance line of the symmetrical triangle. Confirmation can be a 4-hour candle closing above the triangle with increased volume.
Anticipatory Entry: If you prefer a more aggressive approach, consider entering near the support line of the triangle. This is riskier but allows a lower entry price.
Stop-Loss:
Place a stop-loss below the support line of the triangle, approximately around $0.140. This will minimize losses if the pattern fails and the price breaks downwards.
Take-Profit:
Primary Target: Measure the height of the triangle from its widest point and add it to the breakout point. In this case, the target could be around $0.170 - $0.180 if the breakout occurs.
Partial Profit Levels: Take partial profits at key resistance levels, potentially around $0.165 and $0.175, to lock in gains as the price moves up.
Risk Management:
Set position size according to your risk tolerance. A typical risk is 1-2% of the trading capital on a single trade.
Consider adjusting the stop-loss to breakeven once the price moves halfway to the target.
Monitoring the Trade:
Watch the RSI and Stochastic indicators closely; if they remain overbought and the price struggles to break out, there could be a consolidation or even a reversal.
Look for volume spikes on breakout, as they can confirm the validity of the movement.
Exit Strategy:
Exit if the price fails to break out or if there’s a breakdown below the triangle, which would invalidate the bullish setup.
Consider trailing the stop-loss to secure profits as the price approaches higher resistance levels.

About to get K hole'd by your favorite youtuber??Seen this D bag on YT the other day. I only keep him on my subscriptions to know when I should stay away from something(possible scam)... He said he was all in on this shizz coin...
Since than we are down about 30+%(will buy at $0.013 or less if I ever do probably.
.
I promise you that some of these fake azz people are feds and or also market makers in foreign countries Not underneath US legislation.
Hell of a long way to go down like most alt coins do.
If something is popular... You are probably being sold to by multiple fake accounts and during the commercial y'all have fake AI Michael Saylor tell you to send them bitcoin for 2x in return....
Crypto is a scam, the disinformation bs the libs are running is(communism tactics) to stop freedom of speech online and y'all don't believe me we will see in less than 2 years.
I also wany you to understand I'm not left or right. I care for every child of god and of every color equally. Stand for the constitution and freedoms of all or die for nothhing. It's your choice.

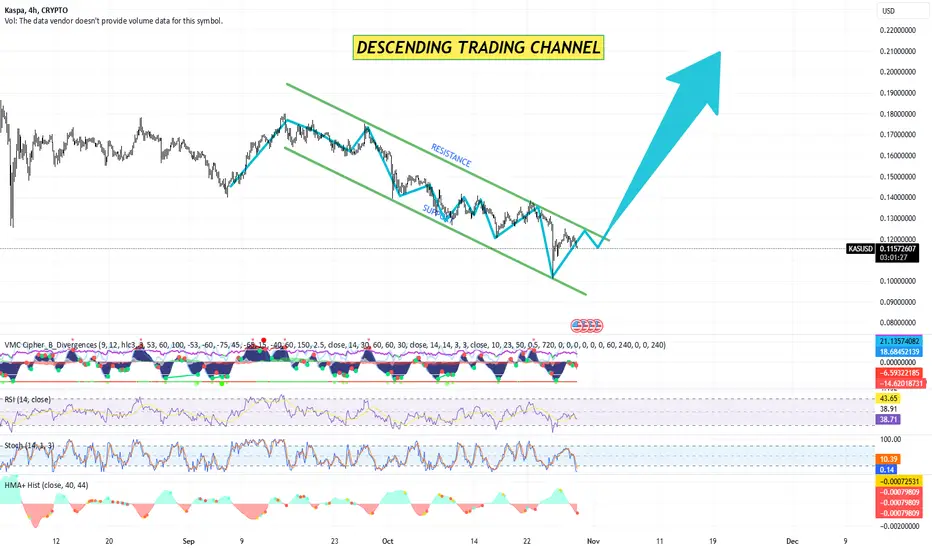
Kaspa – Could this finally be the moment I'm right? TA + TPDescending Trading Channel:
KASPA is currently trading within a well-defined descending channel, with both resistance and support levels guiding its movement.
The price has consistently rebounded from the lower support line while facing rejections near the upper resistance line.
Potential Reversal Signals:
RSI (Relative Strength Index): The RSI is currently around the 39 level, suggesting that KASPA may be entering an oversold zone. This could indicate a potential reversal if the RSI crosses the 40-50 threshold.
Stochastic Oscillator: Showing a reversal from oversold conditions, implying a possible short-term bullish momentum.
VMC Cipher & HMA Histogram: The VMC Cipher indicator and HMA histogram are showing early divergence signals and possible upward momentum, indicating potential price strength if the pattern continues.
Breakout Probability:
If KASPA manages to break above the descending channel’s resistance with sufficient volume, it could signal a bullish breakout.
A breakout above $0.12 with strong momentum could potentially lead to a mid-term upward trend.
Trading Plan
Entry Points:
Aggressive Entry: Enter at the current price around $0.115, anticipating a breakout from the descending channel.
Conservative Entry: Wait for a breakout above $0.12 with a retest and confirmation of support, minimizing the risk of a false breakout.
Stop-Loss Placement:
Place a stop-loss slightly below the current descending support line, around $0.11, to limit potential losses if the price reverses downward.
Profit Targets:
Target 1: $0.14 (near previous highs within the channel).
Target 2: $0.16, aligning with the upper trend lines in a possible new uptrend.
Target 3 (Long-Term): New all-time high (ATH), estimated around $0.22 if momentum sustains.
Time Estimation for New ATH:
Based on previous price cycles and behavior, a bullish breakout from the descending channel could gradually drive the price toward a new ATH in approximately 2-3 months. This timeline considers consolidation phases and typical market momentum seen in KASPA's previous movements.
Risk Management:
Use 1-2% of the portfolio per trade to manage exposure.
Adjust stop-loss and targets as the trade progresses, monitoring for potential corrections or unexpected reversals.
This trading plan and analysis anticipate a bullish breakout based on the current technical setup. However, always monitor for confirmation and adjust for new market conditions.
KASPA - IT'S ABOUT TIME TO MOVE IN UPTREND (TA + TRADE PLAN)Timeframe: 4-hour chart
Current Price: $0.133
Rising Wedge Formation:
Resistance Line: The upper green line represents the resistance level, which is slightly inclining upwards.
Support Line: The lower green line forms the support for this wedge. This support level is also inclined upward but at a slightly steeper angle than the resistance.
Pattern Interpretation: The rising wedge pattern, as observed in the chart, is typically a bearish reversal pattern. However, given the overall crypto market volatility, a breakout in either direction is possible.
Bearish Scenario: A breakdown below the support level would confirm a bearish trend, potentially leading to lower lows.
Bullish Scenario: If the price breaks above the resistance, it could invalidate the wedge pattern and indicate a bullish breakout.
VMC Cipher B Indicator:
This oscillator shows wave momentum, with the darker blue shading indicating downward momentum at present.
Current Signal: Mixed with a potential trend shift. A continuation of negative momentum would reinforce the bearish wedge breakdown scenario.
RSL (Relative Strength Level) Indicator:
The current RSL value is 51.83, indicating neutral territory. This suggests no strong trend is currently dominating but could indicate either upward or downward movement depending on further price action.
Stochastic Indicator:
Stochastic RSI stands at 41.60, which is in the lower-mid range, signaling the asset is neither oversold nor overbought. This neutral stance suggests a wait-and-see scenario for the breakout.
HMA (Hull Moving Average):
The Hull Moving Average histograms are slightly positive, showing marginal bullishness. However, the movement is not aggressive enough to signal a strong upward trend as of now.
Key Levels:
Resistance: Around $0.135 - $0.138
Support: Approximately $0.131 - $0.130
Psychological Support: The $0.130 zone is a critical psychological support. Breaking below this would signal a more significant sell-off.
Indicators Summary:
Momentum: Slightly negative to neutral (VMC Cipher B).
Strength: Neutral, with room for movement either way (RSL 51.83).
Stochastic RSI: Suggests no strong overbought or oversold signals (41.60).
Trading Plan:
Scenario 1: Bullish Breakout
Entry: If the price breaks and sustains above $0.135, it indicates a bullish breakout from the rising wedge.
Take Profit 1 (TP1): $0.145 (first resistance level).
Take Profit 2 (TP2): $0.155 (potential swing high).
Stop-Loss: Set a stop-loss just below the wedge’s lower support at $0.130 to manage risk.
Scenario 2: Bearish Breakdown
Entry: If the price breaks below the support at $0.130, it signals a bearish move.
Take Profit 1 (TP1): $0.125 (first support level).
Take Profit 2 (TP2): $0.115 (next significant support).
Stop-Loss: Place a stop-loss above the wedge's upper resistance at $0.135.
Risk Management:
For both bullish and bearish setups, adhere to a risk-reward ratio of 1:2.
Adjust stop-loss and take-profit based on market volatility and personal risk tolerance.
The rising wedge pattern indicates caution, as it is historically a bearish reversal formation. However, confirmation of either a bullish breakout or bearish breakdown will guide trading decisions. Momentum indicators and oscillators suggest neutrality, indicating that this wedge could break either way soon. Traders should remain vigilant for confirmation signals and place stop-losses to protect against unexpected volatility.

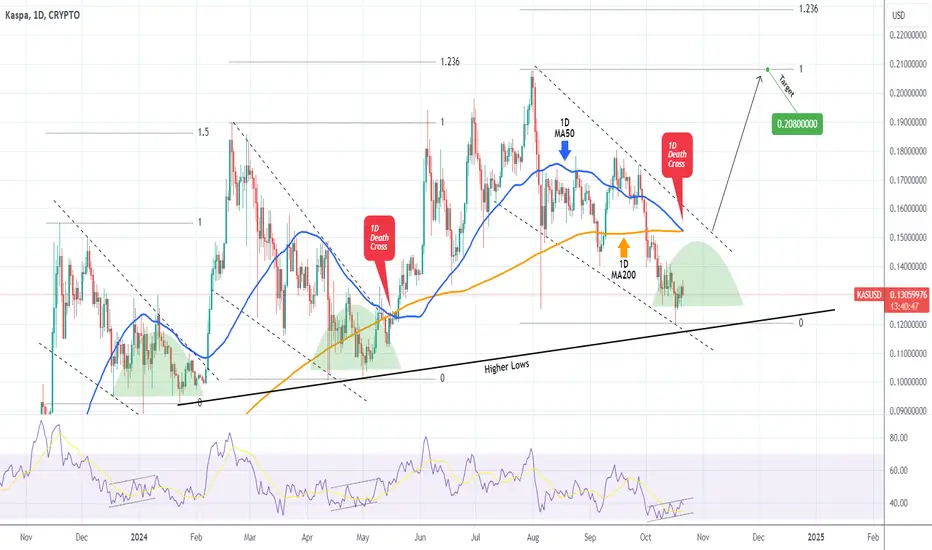
KASUSD Can the 1D Death Cross really save the day???KASPA (KASUSD) has been trading within a Falling Wedge pattern since the July 31 top and is almost on the Higher Lows trend-line that started on the January 23 2024 Low. The key development of the day however, is the formation of the 1D Death Cross, a technically bearish pattern.
Last time it was formed though (May 16), it provided the basis for a strong rally that made a new High. Interestingly enough, the price was also coming off a Falling Wedge at the time that successfully broke above its top. In the meantime the 1D RSI was after a Bullish Divergence, essentially a bottoming process. In fact, it was the same formation of that the Falling Wedge before it (November - December 2023) had, that also broke aggressively above its top.
As a result, we have a potential triple bullish signal and as long as the Higher Lows hold, there are high probabilities of seeing the price break above the Wedge and target at least the previous High at 0.20800.
-------------------------------------------------------------------------------
** Please LIKE 👍, FOLLOW ✅, SHARE 🙌 and COMMENT ✍ if you enjoy this idea! Also share your ideas and charts in the comments section below! This is best way to keep it relevant, support us, keep the content here free and allow the idea to reach as many people as possible. **
-------------------------------------------------------------------------------
💸💸💸💸💸💸
👇 👇 👇 👇 👇 👇
KASPA IS GOING UP SOON! TA + TRADE PLAN BY BFSymmetrical Triangle Pattern:
In the image, a symmetrical triangle has formed on the KAS/USD chart, indicating a period of consolidation. This pattern suggests that neither the bulls nor the bears are in control, and a breakout could occur in either direction.
Resistance is shown as the upper trendline, which has seen multiple rejections of price moving higher.
Support is established by the lower trendline, providing a floor for price movements.
Price Action:
The current price is hovering near the lower support of the triangle ($0.135) after testing the resistance level.
A bounce from this level could push the price towards the upper boundary of the triangle.
Once price consolidates further within the triangle, a breakout is expected.
Indicators:
VMC Cipher B (Volatility and Momentum): Shows that momentum has been fluctuating within this consolidation period. The indicator reveals divergences, which could signal potential reversals or trend continuations.
RSI (Relative Strength Index): Currently around 45, suggesting the market is in a neutral state. There is no immediate overbought or oversold signal, which aligns with the symmetrical triangle's nature.
Stochastic Oscillator: The Stochastic (shown in the lower panel) is just emerging from oversold conditions, indicating the possibility of an upward movement, aligning with the expectation of a potential upward breakout.
Volume Analysis:
Though volume data is not provided in the chart, typically, symmetrical triangles see decreasing volume during consolidation and a spike in volume at the breakout.
Professional Trading Plan
Entry Strategy:
Aggressive Entry: Buy near the lower trendline support (~$0.130 - $0.135). This provides an optimal risk-reward setup, as the price could potentially rebound from this area.
Conservative Entry: Wait for a confirmed breakout from the triangle's resistance or support with increased volume. If the price breaks above $0.140 with strong momentum, initiate a long position. For bearish confirmation, if it breaks below $0.125, consider shorting.
Exit Strategy:
Profit Target for Bullish Breakout: Measure the height of the triangle and project that onto the breakout point. The expected upward price target is approximately $0.155 to $0.160.
Profit Target for Bearish Breakout: If the triangle breaks downward, a short position target could be $0.120 to $0.115.
Stop Loss:
For a Long Position: Place a stop loss slightly below the support trendline (around $0.125). This minimizes risk if the price breaks below the triangle.
For a Short Position: Place a stop loss slightly above the resistance trendline (around $0.142). This minimizes risk if the price breaks upward unexpectedly.
Risk Management:
Always keep a risk-reward ratio of at least 1:2. Risking 1% of your capital should aim to generate a 2% or higher return.
Adjust position sizes according to account size and overall risk tolerance.
Monitoring:
Keep an eye on the RSI and Stochastic Oscillator for further confirmation of price movement.
Volume is critical; a breakout without volume may lead to false signals.
Regularly monitor any news events or major market movements that could impact cryptocurrency sentiment.
Conclusion:
Bullish Scenario: If KAS/USD successfully breaks through the resistance line, there is strong potential for a continuation to the $0.155 range.
Bearish Scenario: If the support breaks, a downward move towards $0.120 is possible.
This trading plan provides a structured approach, balancing risk and reward effectively while following the chart's technical setup.

Is Kaspa ($KAS) About to Repeat History?Is Kaspa ( CRYPTOCAP:KAS ) About to Repeat History?
Looking at Kaspa’s price action, we are approaching a key bottom based on its power law model. Historically, Kaspa has followed its own unique cycles, with the -50% deviation from the power law providing ultimate buy opportunities. These moments are rare, and we are currently hovering around that critical zone, signaling a potentially high reward entry point.
While past cycles weren’t always perfectly aligned, the bottom signals have consistently been amazing buy zones. If Kaspa continues to follow its power law trend, this could be a golden opportunity for those looking to enter at a strategic price.
Does the news even matter, or should we simply wait for Kaspa to grow in USD value over time?
With Kaspa’s cyclical nature, it seems that patience could pay off massively. The power law has proven to be a reliable guide so far, and right now, we may be witnessing another rare buying window.
Key Points:
Approaching a -50% deviation from Kaspa’s power law: Historically rare and highly profitable
buy zone.
Kaspa follows its own cycles, and we may be at another cyclical bottom.
The risk-to-reward ratio in this area could be massive if history repeats itself.
What do you think—will Kaspa follow its power law and surge, or are we in for a new pattern?
📉💥 Ultimate buying opportunity?
#Kaspa #KAS #Crypto #PowerLaw #Cycles

KASPA - Long into OctoberKASPA is still maintaining pretty bullish structure, the recent FED rate news will probably push some money back into stocks and crypto over the next five weeks or so. Close to neutral on DegenerShift, coming down out of peak greed levels. I'm targeting 0.22 and would like to see KAS stick the landing above 0.20. I think KAS will at least test this.

Kaspa Speculation 2024Just playing around here with a speculative price possibility considering some metrics provided by PlanK @MikoGenno on X.

KAS - NeutralKAS is settling under the sharp uptrend bull channel, and is somewhat in the middle of the longer term bull channel. I'm Neutral to slightly bullish from here, actually slowly DCA'ing back into this one after recent profit taking. Neutral on MACD and Fear & Greed index.

Kaspa breakout before November 2024We are seeing incredible pressure being built here for a price action move to the upside with Kaspa. The Fibonacci zone for this could be at 2.618 at a price range of about $0.50 ish. I am giving this a time frame before November 2024. There is an ascending channel that Kaspa is dying to break out of and most likely the upside. Too many bullish points that Kaspa is waiting on and these fundamentals could help propel price action higher. For example, Tier 1 listings, Krc20 launch, 10 BPS implementation, Kaspa Institutional Initiative KII, Kaspa Ecosystem Foundation KEF, and more like Marathon competitors coming in to take mining market share etc.......

KAS - Neutral to slightly bullish next week.KAS - KAS must maintain 0.16382 to maintain bullish structure with a possible move to 0.19. If it invalidates, I expect it will move out of the short-term bullish channel and retest the lower end of the longer-term bull channel - so it could go as low as 0.14 or even 0.12. Overall - Neutral to Bullish until we see invalidation of bullish structure.

KAS - Slightly bullish, make or break in the next few daysKAS - Slightly bullish. MACD coming back to neutral, despite recent selling pressure and bearish divergence. KAS is still staying within the larger bull channel and held at the 0.12 cent level, so I expect a possible bounce to 0.17 before coming back down to the 200 DMA. If we hold at the 0.14 level, I foresee KAS testing the shorter bull channel lower bound which is now resistance.
If KAS does not hold at the 0.14 level over the next few days, I expect it will test the bottom of the larger channel which is in the 0.12 cent range. In that case, it might bounce off the bottom of the channel keeping in the bullish structure but a death cross can push KAS out of that channel quickly on failure.

Kaspa - BullishKaspa - Bullish. Kaspa has been green in a sea of red this past week, still very bullishon the daily with a healthy pullback.
-Tested the top of the long-term bullish channel which started 11/04/2023.
-Moving with the more recent bullish channel starting 5/1/24.
-Keeping with the long-term trendline with a healthy pullback to 0.18269 (keeping with trendline)
-Pullback from the highs of 0.2078 on 8/2/24, matching up with when it was overbought on the MACD.
-Pullback on 8/2/24 coincided with peak fear on the fear & greed index, coming out of peak greed zone toward neutral 8/3/24.
I think KASPA will hold at 0.1859, or possibly tag the bottom of the bullish channel (which it historically likes to do) at 0.1802 before moving to retest the top part of the long-term channel and advance out of that while in the short-term bullish channel to 0.2233. I especially think this will be the case if the wider crypto market is still bleeding on 8/3/24 when the US session gets started.
Invalidation would be if on 8/3/24 we see a sustained pullback below 0.1802.

KASPA - Bullish!KAS - MACD is still showing room to run and KASPA hasn't reached peak greed on the fear and greed index. KAS breached the important psychological level of 0.20, even during wider market turmoil on the 30th. So far...no major bearish divergences!
My initial TP level from previous charts was 0.21 however, based on the indicators and interest in this coin I'm amending TP levels to 0.25, and 0.34. Invalidation will be when we see strong bearish divergence but so far, still looking incredibly strong on daily, weekly, monthly charts.
This is the kind of chart I really like, long-term steady growth with overall wide organic market accumulation. Honestly, it reminds me a lot of BTC in the early days in terms of it's long-term growth pattern and steady accumulation. I don't think larger exchanges like CB can ignore this coin for much longer.
