Resistance is claerly there, just takeitIt just so obvious the delta is there, resistance, just take the trade

KASUSDT Analysis (30-Minute Timeframe) Key Levels on the Chart:
Broken Resistance Turned Support:
Around the 0.07520 – 0.07600 zone, there was a significant resistance area that has now been broken and is acting as new support (shown as a red box on the chart). Price broke above it with a strong candle and is currently consolidating ab

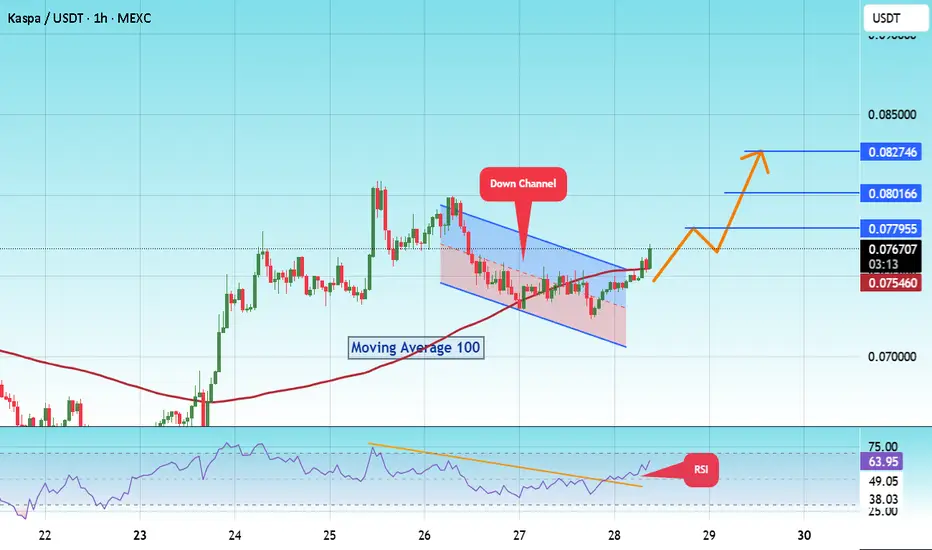
$KASUSDT Breaks Trendline #KAS
The price is moving within a descending channel on the 1-hour frame and is expected to break and continue upward.
We have a trend to stabilize above the 100 moving average once again.
We have a downtrend on the RSI indicator that supports the upward break.
We have a support area at the lowe
$KAS – Three Possible Scenarios in the Near FutureCSE:KAS – Three Possible Scenarios in the Near Future:
🔹 Optimistic: Growth up to $0.21
🔹 Conservative: Growth up to $0.13
🔹 Pessimistic: Decline to $0.035
🚨 Key Levels to Watch:
▪️ $0.075 — a breakout above this level in July could open the path to $0.10 – $0.11
▪️ $0.11 — a breakout above th

KAS IS TESTING RED RESISTANCE ZONE🚨 KAS Testing Red Resistance – Waiting for Breakout 📈
KAS is currently testing the red resistance zone.
If breakout is confirmed, the first target could be the green line level! 📊

Technical Analysis (KASPA/USDT - Daily Chart)Technical Analysis (KASPA/USDT - Daily Chart)
Trend & Structure Overview
KASPA has been in a prolonged downtrend after peaking near $0.22.
The Elliott Wave structure indicates a completed (A)-(B)-(C) correction pattern after a prior bullish wave (4).
Price is currently testing a triple bottom s

Kaspa (KAS): Seeing Possibility of Break of StructureKaspa coin struggles to have a proper buyside volume, where sellers are showing strong dominance currently, which could lead us to BOS and nasty movement to lower zones (and by nasty I mean big red candle).
Swallow Academy

KAS 0.53 ZONE IS BEST SUPPORTBINANCE:KASUSDT.P is right now facing heavy selling pressure, should plan at 0.052-0.054 zone, not a financial advise, DYOR

KAS-USDT (Bybit spot), 4-hour candles TA+Trade plan1. Market context & chart structure
Asset / venue / timeframe: KAS-USDT (Bybit spot), 4-hour candles, data to 12 Jun 2025 06:45 UTC (see image).
Primary pattern in play: Price has compressed into a contracting (symmetrical) triangle that began after the 28 May low. The apex is only ~1–2 candles a

TradeCityPro | KAS Ranges Near Top with Bullish Momentum Rising👋 Welcome to TradeCity Pro!
In this analysis, I want to review the coin KAS for you. It’s one of the Layer One projects, and its token currently ranks 40 on CoinMarketCap with a market cap of 2.35 billion dollars.
⏳ 4-Hour Timeframe
On the four hour timeframe, the price is moving inside a range box

See all ideas
Summarizing what the indicators are suggesting.
Oscillators
Neutral
SellBuy
Strong sellStrong buy
Strong sellSellNeutralBuyStrong buy
Oscillators
Neutral
SellBuy
Strong sellStrong buy
Strong sellSellNeutralBuyStrong buy
Summary
Neutral
SellBuy
Strong sellStrong buy
Strong sellSellNeutralBuyStrong buy
Summary
Neutral
SellBuy
Strong sellStrong buy
Strong sellSellNeutralBuyStrong buy
Summary
Neutral
SellBuy
Strong sellStrong buy
Strong sellSellNeutralBuyStrong buy
Moving Averages
Neutral
SellBuy
Strong sellStrong buy
Strong sellSellNeutralBuyStrong buy
Moving Averages
Neutral
SellBuy
Strong sellStrong buy
Strong sellSellNeutralBuyStrong buy
Displays a symbol's price movements over previous years to identify recurring trends.