KASKAS on the HTF seems it is doing a similar pattern with the November consolidation below ATH before explosive expansion.
More of a HTF guide than actual trading based on it but helps with spot bags conviction
KASUSDT trade ideas

Kaspa inverted head and shoulder bullish pattern $KASLooking at the KAS chart on the 4 hr tf, there's a potential for an inverse head and shoulders pattern, which usually signals a bullish reversal
Disclaimer: The information provided here is for educational purposes only and does not constitute a buy or sell recommendation. I am not a financial advisor and I reserve the right to be incorrect. Do not make trading decisions based on information from the internet. Always consult your financial advisor or conduct your own research before making any investment decisions.


KAS 8HRI see a very nice short here on KAS. Looking too clear vector zone on the way down into the golden pocket fib, you should lose yearly vwap on the way to the downside

Bullish Pennant Structure seen in KASPA - $KAS The hourly chart shows a bullish pennant structure which is a bullish pattern.
Disclaimer: The information provided here is for educational purposes only and does not constitute a buy or sell recommendation. I am not a financial advisor and I reserve the right to be incorrect. Do not make trading decisions based on information from the internet. Always consult your financial advisor or conduct your own research before making any investment decisions.

Kaspa ThesisThis is not a price prediction its just my thesis for Kaspa, 2 Escenarios: one Bullish and favorable for Investors and another Bearish and not Favorable (Fishy Behavior).
Im Bullish so Far.

KASPA forming distribution , local top???As much as I love kaspa it looks like we are in for a retracement down 50% or more from current levels. id be interested in picking this up under 7 cents.

Technical Analysis of KAS/USDT (4-Hour Chart) #kaspa $kas #usdtTechnical Analysis of KAS/USDT (4-Hour Chart) by Blaž Fabjan
The chart displays a falling wedge pattern, which is typically a bullish formation, indicating a high probability of an upward breakout.
Indicators:
VMC Cipher B Divergences: This indicator shows bullish divergences at multiple points, supporting the possibility of an upward breakout.
RSI (14): Currently at 39.82, indicating the market is somewhat oversold and we may expect price growth.
Stochastic Oscillator (14, 1, 3): Values are 34.88 and 36.88, indicating an oversold condition, often a buy signal.
Recommended Entry Points for Trading:
Intra-Day Trading:
Entry: $0.145 (at the current price or upon a slight dip)
Target Price: $0.155 (first resistance level)
Stop Loss: $0.140 (to protect against significant losses)
Swing Trading:
Entry: $0.145 (at the current price or upon a slight dip)
Target Price: $0.165 - $0.170 (potential breakout from the falling wedge)
Stop Loss: $0.135 (to protect against significant losses)
Recommended Exit Points for Trading:
Intra-Day Trading:
Exit Price: $0.155
Alternative Exit Price: $0.150 (if the market shows signs of weakness)
Swing Trading:
First Target Price: $0.165
Second Target Price: $0.170
Exit Price on Reversal: $0.135 (to protect against significant losses)
Summary:
Based on the technical analysis and applied indicators, the current trend for KAS/USDT is positive, with potential for an upward breakout from the falling wedge. Recommended entry points are at the current price of $0.145 with target prices of $0.155 for intra-day trading and $0.165 - $0.170 for swing trading. Closely monitor the market and use stop loss to protect against unexpected downturns.

Crypto + 3 Step Rocket Booster Strategy - Recap VideoThis is the recap video of the rocket booster strategy now this video i break down to you
how important it is to master technical analysis
and why this strategy is called the rocket booster
--
Also, check out the references below to learn more
--
Disclaimer; Trading is risky please learn risk management strategies because you will lose money

The 3 Step Rocket Booster Strategy In Crypto TradingNow when you look at this chart you can see that the price is at a resistance level
after a double top - this double top is what gives the look to the price chart like a rocket.
Now am going to show you the rocket booster strategy on this chart and it is as follows:
Step 1- The price is above the 50 MA
Step 2- The 50 MA Is Crossed above the 200 MA
Step 3- The price has gapped above the MA's
This is the rocket booster strategy now you need to learn more about market psychology
but this is not what this article is about this article is about
introducing you to technical indicators in order to give you the ability
to analyse trends.
Remember to rocket boost this content to learn more.
Disclaimer: Trading is risky you will lose money wether you like it or not, please learn risk management.

Kaspa Power Law - Ascending TriangleMEXC:KASUSDT is forming an Ascending Triangle on the Daily timeframe.
MA 50 and MA 100 have crossed.
There probably is a nice SELL Order Block on 0.150996 which is resistance.
This could go several ways:
Scenario : A). (Very bullish)
1. We'll retest the Order Block on 0.111402 before a breakout to the Upside.
2. Price will retest both moving averages to give us a clearer picture.
3. If the moving averages reject the price, expect the confirmation of a bullish cross.
4. Wait for a clean signal: IF OB at 0.112341 rejects price and the MA Cross stays positive = the ascending triangle will rip to the upside.
Potential +600%
Scenario: B).
1. If OB at 0.112341 doesn't reverse the downtrend, the Ascending Triangle is breaking to the downside.
2. If the price breaks downwards, expect to retest the OB at 0.094076
Scenario: C). (might be unrealistic but its still crypto, always expect capitulation before bulls)
1. OB at 0.094076 will not be filled, causing further liquidations and downtrends toward the OB at 0.053304 placing it on a whopping -60%
Let me know what you think, I'm personally very bullish on Kaspa and would love to see it ripping. KRC20, new exchange listings on exhanges. I usually expect negative price action before positive one because that's kinda my luck. I'd love to hear your opinion, I can learn more that way.
Thanks for reading! NFA

$KAS to $0.40I think we could see CRYPTOCAP:KAS going to 0.13 by the end of the month, then we can see a strong bounce to 0.19.
if we break the 0.19 we could see a 0.24/0.26.
The KRC-20 comes and then we could see a massive leg up to the 0.40+.
Just a prediction...
What do you guys think?
in my earlier idea's i said that CRYPTOCAP:KAS will go down to the 0.13 again.

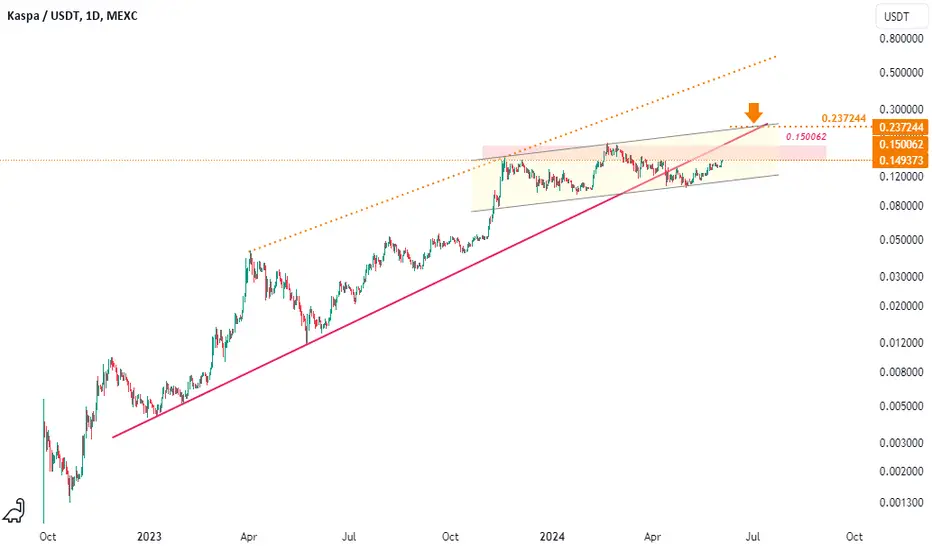
KAS: Pullback in UptrendTrade setup : Following a breakout from Falling Wedge pattern and above 200-day moving average, price signaled resumption of Uptrend. However, it reached $0.19 resistance where it got rejected in February and was also very overbought (RSI > 80), and pulled back on profit taking. This is almost identical situation to that in February. We would be buyers on pullbacks near $0.15 support area for another swing trade entry with +25% upside potential back to $0.19. Stop Loss (SL) at $0.138. If price breaks above it's ATH of $0.194, the next possible resistance levels (price targets) based on Fibonacci Extensions are: $0.207 (61.80%), $0.223 (78.60%), $0.243 (100%) and $0.30 (161.80%).
Pattern : Pullback in Uptrend. Price remains in an Uptrend but has pulled back, which could present a 'buying dip' opportunity. Traders should look for the nearest support level where price could stabilize and resume its Uptrend. This support level could be a level where price bounced off of in the past, or a level that was previously resistance. (concept known as polarity).Learn to trade key levels in Lesson 3.
Trend : Short-term trend is Strong Up, Medium-term trend is Strong Up and Long-term trend is Strong Up.
Momentum : Price is neither overbought nor oversold currently, based on RSI-14 levels (RSI > 30 and RSI < 70).
Support and Resistance : Nearest Support Zone is $0.15, then $0.13. Nearest Resistance Zone is $0.194, then $0.24.

KASPA: Pullback in UptrendTrade setup : Following a breakout from Falling Wedge pattern and above 200-day moving average, price signaled resumption of Uptrend. However, it reached $0.19 resistance where it got rejected in February and was also very overbought (RSI > 80), and pulled back on profit taking. This is almost identical situation to that in February. We would be buyers on pullbacks near $0.15 support area for another swing trade entry with +25% upside potential back to $0.19. Stop Loss (SL) at $0.138. If price breaks above it's ATH of $0.1.94, the next possible resistance levels (price targets) based on Fibonacci Extensions are: $0.207 (61.80%), $0.223 (78.60%), $0.243 (100%) and $0.30 (161.80%).
Pattern : Pullback in Uptrend . Price remains in an Uptrend but has pulled back, which could present a 'buying dip' opportunity. Traders should look for the nearest support level where price could stabilize and resume its Uptrend. This support level could be a level where price bounced off of in the past, or a level that was previously resistance. (concept known as polarity).Learn to trade key levels in Lesson 3.
Trend : Short-term trend is Up, Medium-term trend is Strong Up and Long-term trend is Strong Up.
Momentum is Bullish but inflecting. MACD Line is still above MACD Signal Line but momentum may have peaked since MACD Histogram bars are declining, which suggests that momentum could be nearing a downswing. Price is neither overbought nor oversold currently, based on RSI-14 levels (RSI > 30 and RSI < 70).
Support and Resistance : Nearest Support Zone is $0.15, then $0.13. Nearest Resistance Zone is $0.194, then $0.24.

KASPA priceDespite the bearish market sentiments, Kaspa token has witnessed significant buying interest and pumped over 20% and made a new ATH mark this week.

what can i do?Be careful as long as it is below the strong red resistance line.
Currently, it is fluctuating inside the yellow channel and has a red resistance range and the same red line in front of it.
In short, for ideal growth, it should be able to go above the yellow channel
KAS/USDT Descending Triangle Pattern -10%on the 4 hour you see lower highs, with a support on the 0.155.
In a few days we can see a -10% in the KAS/USDT.

#KAS/USDT breaks and retests the Diagonal Trendline in 1-Hour TF#KAS/USDT breaks and retests the Diagonal Trendline in 1-Hour TF!
CRYPTOCAP:KAS looking bullish here. #KASUSDT local resistance level is PWH $0.19515, and the local support level is $0.15515.

KASPA: Pullback in UptrendTrade setup : Following a breakout from Falling Wedge pattern and above 200-day moving average, price signaled resumption of Uptrend. However, it reached $0.19 resistance where it got rejected in February and was also very overbought (RSI > 80), and pulled back on profit taking. This is almost identical situation to that in February. We would be buyers on pullbacks near $0.15 support area for another swing trade entry with +25% upside potential back to $0.19. Stop Loss (SL) at $0.138.
Pattern : Pullback in Uptrend . Price remains in an Uptrend but has pulled back, which could present a 'buying dip' opportunity. Traders should look for the nearest support level where price could stabilize and resume its Uptrend. This support level could be a level where price bounced off of in the past, or a level that was previously resistance. (concept known as polarity).Learn to trade key levels in Lesson 3.
Trend : Short-term trend is Strong Up, Medium-term trend is Strong Up and Long-term trend is Strong Up.
Momentum is Bullish but inflecting. MACD Line is still above MACD Signal Line but momentum may have peaked since MACD Histogram bars are declining, which suggests that momentum could be nearing a downswing. Price is neither overbought nor oversold currently, based on RSI-14 levels (RSI > 30 and RSI < 70).
Support and Resistance : Nearest Support Zone is $0.15, then $0.13. Nearest Resistance Zone is $0.19.

$KAS ready for big move
> Trading a descending channel pattern involves identifying a bearish trend where the price consistently forms lower highs and lower lows within a channel. Here's how you can approach trading this pattern:
1. **Identify the Descending Channel:** `The first step is to recognize the descending channel pattern on a price chart. Look for a series of lower highs and lower lows forming parallel trendlines sloping downwards. This pattern suggests a bearish trend where sellers are in control. Confirm the pattern by ensuring that the price touches both the upper and lower trendlines multiple times.`
2. **Entry and Exit Points:** `When trading a descending channel pattern, consider selling (shorting) near the upper trendline of the channel when the price reaches this level. This is where resistance is likely to be strong, presenting an opportunity to enter a trade with lower risk. Set a stop-loss order above the upper trendline to manage risk in case the price breaks out of the channel. Aim to exit the trade near the lower trendline of the channel, where buying pressure may increase, providing a potential opportunity to take profits.`
3. **Risk Management and Confirmation:**` Implement proper risk management techniques to protect your capital. This includes setting stop-loss orders to limit potential losses if the trade goes against you. Additionally, look for confirmation signals such as bearish candlestick patterns, negative momentum divergence, or other technical indicators aligning with the descending channel pattern to increase the probability of a successful trade. `
Remember, trading patterns carry inherent risks, and it's essential to practice proper risk management and conduct thorough analysis before making trading decisions. Additionally, consider using a combination of technical indicators and fundamental analysis to enhance your trading strategy and increase the probability of success.


Ready for a discount ? $KASif we dont hold on a 0.149 expect we are going to test the 0.13 again!
Get ready to grab some bags!

