KAS be patientKAS will blast after the election. It grew during the bear market, Marathon are suppressing the price because they have to sell KAS to balance their books until BTC breaks $70K. When this happens their BTC mining is in profit, they have no need to sell their KAS and it KAS will resume. The network performed amazingly well for KRC-20. Everything is on track, dont give your future prosperity away now KASparians
KASUSDT trade ideas

KASPA - A market leaderDespite markets conditions, this monster is one of the market leader; heading up and leading the market.
Breaking up a VCP pattern; this coin is consolidating his up trend, confirming a strong momentum.
0.20 is the rotation pivot level. or buy entry if the price stays above it...
+20% its around 0.25... thats our first potential target
What do you think?
Good Trading

KAS/USDT-2H-Coinex & BingxThis is not a financial advice. Always do your own research and always put stoploss in your trade (SL) :) If you want more detailed info
how to study and read charts or just need help with some coin, just write to me here a comment, i will try to answer to everybody...
i can help you :) all for free, don't worry, BE HAPPY!

KASPA - Ready to dump15% rest break for a strong rise.
Kaspa will continue to make a difference with its technology and community.
But this does not prevent a fall.

The Pattern Looks Very TastyThe pattern will keep pushing up until 0.44.
But don't forget to put SL, especially if you are trade in Derivatives Market.

Kaspa technical analysis + trade plan (27.09.2024) by BFTechnical Analysis + trade plan by Blaž Fabjan
Chart Pattern: Falling Wedge (Uptrend Bias)
A falling wedge pattern is present, which typically signals a bullish reversal. In this case, the price seems to be nearing the breakout point of the wedge. The breakout direction is upwards, and this pattern typically leads to a price increase if confirmed.
Support and Resistance Levels
Resistance Line: The upper line of the falling wedge, acting as dynamic resistance.
Support Line: The lower line of the wedge, acting as dynamic support.
Volume
Volume levels indicate significant interest, especially when approaching a potential breakout zone. The volume profile shows that recent trading sessions have been accompanied by a spike in activity, which can be a good sign for momentum.
Indicators
VMC Cipher B (Divergences): This indicator shows divergence signals, indicating possible trend reversals. It appears to be bullish with green dots forming at key points, suggesting an upward move.
RSI (Relative Strength Index): The RSI is around 54.79, which is neutral but slightly tilting towards bullish. It suggests that the market isn't overbought or oversold.
Stochastic Oscillator: Around 75.24, this indicator shows a bullish cross, indicating momentum might be shifting upward, but it's approaching the overbought zone.
HMA+ Histogram: Appears to be indicating short-term momentum change as the trend might be shifting upwards.
Price Prediction/Target
If the falling wedge plays out as expected, the price could target higher levels, breaking the $0.165-$0.170 range. The chart suggests a further upward target in the next phase, as highlighted by the projected arrow and airplane symbol.
Trading Plan
Entry Strategy:
Buy on Breakout: If the price breaks above the resistance line of the falling wedge (around $0.166 or slightly higher), consider entering a long position.
Confirmation: Wait for at least a 4-hour candle close above the resistance to confirm the breakout.
Aggressive Entry: You could also enter once the price reaches near the support line but remains cautious if the breakout has not been confirmed.
Stop Loss:
Place a stop loss below the recent swing low or just under the support line of the wedge (around $0.160). This will protect against a potential fake breakout.
Take Profit Targets:
Short-term Target: $0.175 - $0.180 (the first major resistance after breakout).
Medium-term Target: $0.190 and beyond, as indicated by the chart.
Risk Management:
Avoid risking more than 2-3% of your total portfolio on this trade.
Adjust your position size based on the stop-loss distance and your risk tolerance.
Monitoring:
Keep an eye on the volume and the RSI levels. If RSI enters the overbought zone (above 70), consider reducing your position or securing profits.
Watch for any signs of a failed breakout, as this could lead to a sharp drop back into the wedge pattern.
Exit Strategy:
If the price fails to break out and starts to drop below the support line, exit the trade.
If the price hits the overbought zone on both RSI and Stochastic, it might be wise to secure profits at key levels mentioned.
Conclusion:
The overall outlook based on the chart suggests a bullish breakout is likely if the falling wedge pattern completes. This offers a good risk-to-reward ratio for a long position if managed carefully with proper stop losses and monitoring of key indicators like volume and RSI.


KASPA USDT 4H CHART TA+price predictionHi! Today I will analyze Kaspa / Usdt chart on 4h timeframe and I will look up what's following in near future - price prediction. TA by Blaž Fabjan
The descending triangle is highlighted, signaling a potential bearish continuation or reversal.
1. Resistance is marked on the chart, suggesting that the price is struggling to break above that level.
2. Support is seen near the base of the triangle. If this support level breaks, a more significant downside is expected.
Indicators:
VMC Cipher Divergences: Suggesting a mix of bullish and bearish divergences. Current momentum appears bearish, as evidenced by the divergences. However, there could be a potential reversal, depending on the market structure.
RSI (Relative Strength Index): Sitting near the lower range (~42.77), which suggests that the asset is not yet oversold, but it's approaching a level that could present a buying opportunity if oversold conditions are met.
Stochastic RSI: It appears oversold (~42.35), indicating that a reversal or upward momentum might be due soon.
Price Action:
The chart shows a potential downward move towards the lower boundary of the triangle, which is marked with an emoji representing the target zone. A bounce from this zone may lead to a bullish breakout, as indicated by the upward arrow.
If the price falls below the triangle, the next support is likely around the $0.1500 level (as per the emoji), with a possible further decline if that level is breached.
Volume:
The volume appears stable, but no significant spikes indicate a strong trend change or momentum yet. Low volume during a potential breakdown would suggest a weaker move, while a volume spike could confirm the breakout/breakdown.
Trading Plan
Short-Term Outlook (Bearish Continuation):
Entry: If the price breaks below the current support at ~$0.1600, short positions could be considered, targeting the next support near $0.1500 or lower.
Stop Loss: Set just above the resistance level, around $0.1700, to minimize risk.
Target: Short-term targets would be $0.1500 (first support), potentially moving lower depending on market conditions.
Bullish Reversal (Medium- to Long-Term Outlook):
Entry: If the price bounces off support (as indicated by the chart), wait for confirmation of a reversal before entering. Look for a close above $0.1700 as a bullish sign.
Stop Loss: Set below the triangle's lower boundary at ~$0.1550.
Target: First target could be around $0.2100, following the chart’s indication of a potential sharp upward movement. Breakouts from descending triangles often lead to significant upward momentum.
Confirmation:
Wait for confirmation of direction either through volume increase or a clear breakout from the triangle. Trade cautiously within the triangle as price movements could be choppy.
In summary, the chart suggests a possible short-term bearish movement towards the $0.1500 level, followed by a potential bullish reversal. Watch for breakout confirmation and act accordingly based on the defined trading plan.

KAS/USDT Trading ScenarioThe KAS’s price chart continues to follow an upward trend, with the trendline successfully acting as a support level four times, indicating its significant strength. From a volume profile perspective, the current asset price is in a zone of heightened market participant interest, with a key volume level POC at $0.16833.
After the news about a potential Fed rate cut, a short-term correction is likely, as the market has probably already priced this event in. In this case, we may see sell-offs following the news release. However, in the long term, growth potential remains, with the trendline, once again being tested, serving as a possible reversal point.

Kaspa spot long ideaLooking to accumulate Kaspa for my mid-long term bag. Weekly chart looks good and kept forming a higher high with higher low. Fundamentals wise it’s a great project as well.
Mining emission for Kaspa decreases monthly compared to BTC every 4 years. Bullish on this project.

Kaspa Go TimeHeld weekly trend line, mini cup and handle echo playin out, American CEX announcement imminent, poss Kracken. Kasplex fixed, meme minting about to begin, CPI came in @2.5% way below FED predictions. What happens if FED takes initiative and cuts 50 basis points. Bye bye bears, put your helmets on Kaspa crew. Kaspa could be THE new money and we are so early.

Kaspa | Correction TimingThere's been two corrections since Kaspa entered high territory. One lasted 65 days and the other one lasted 71 days.
Projecting these time periods into the future, from peak to valley, would put us at 5-Oct and 11-Oct. Now, these don't need to be exact, just a map as usual.
There were also two bullish waves and while one latest 28 days, the second one lasted 92 days, so you can see the big difference.
If Kaspa's current correction lasts between 60-80 days, this would put the end of it before late October.
👉 KASUSDT is moving with a bearish bias and can produce a lower low next.
Namaste.

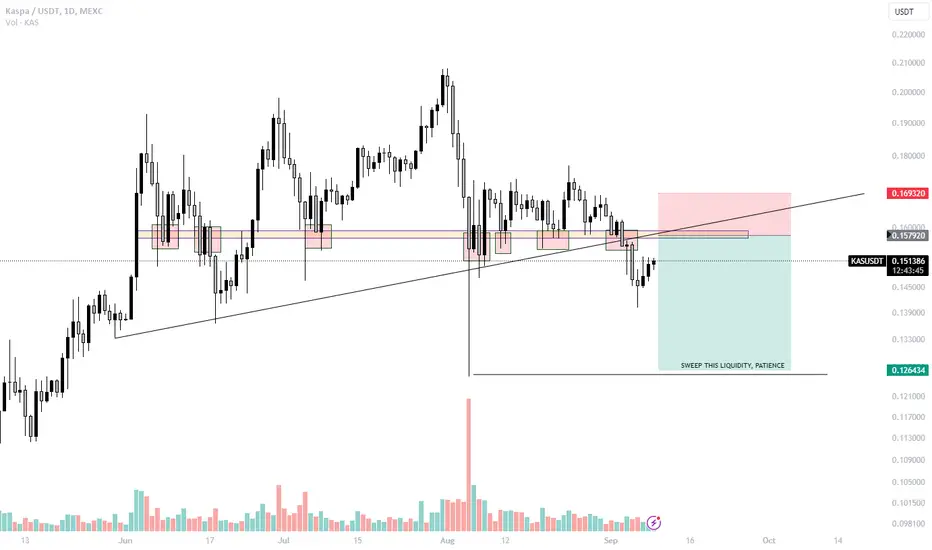
Liquidity Wicks are Swept 9/10 timesExpect this to work out as planned.
Don't see that liquidity wick marking the bottom here.
You need to always be looking at where liquidity lies in the market.
This is where big institutions drive price because it's also regions where people have their stops below.
Peaks in NovembersPeaks in Novembers, lets see how it perfoms the next year and a half. Could go to 4 dollars in November of 2025. The deathZone is under 0.5 dollars, Yonatan Sompolinsky has stated that kaspa will die if it is under 0.5 when mining rewards decline to about 5 kaspa per block.

Livermore Kaspa/Bitcoin ChartLivermore Kaspa/Bitcoin Chart overlay is indicating explosive mooves are on the horizon. The Parma bulls will rocket this ship up up up up to the moon! Grow the Bitcoin bag with Kaspa magic

Long KAS to Oktober 2025Yonatan Sompolinsky is the founder of Kaspa. In addition to his work on the GHOSTDAG protocol, Yonatan has extensive experience in blockchain research and development. He holds a Ph.D. in computer science from Hebrew University and has published numerous academic papers on topics related to blockchain technology. Yonatan started gaining a reputation within the cryptocurrency academic circle back in 2013 when he and Professor Zohar conceived the GHOST protocol, a protocol famous for being cited in the Ethereum whitepaper as a design goal. Yonatan currently holds a post-doctoral position at Harvard researching transaction ordering protocols and MEV.
Kaspa’s official website: kaspa.org
Kaspa is the world's first blockDAG, which stands for Directed Acyclic Graph, that uses proof of work. Unlike traditional blockchain architectures, where transactions are processed in a linear fashion, a blockDAG creates a graph of blocks, where each block has multiple child blocks. This unique approach allows Kaspa to achieve parallel processing, enabling multiple transactions to be confirmed simultaneously, resulting in lightning-fast transaction times.
The scalability of traditional blockchain architectures has been a major issue since the inception of Bitcoin (The blockchain trilemma). The linear structure of blockchains(linked list block structure) limits the number of transactions that can be processed in a given time, which has resulted in significant delays and high fees during times of network congestion. The blockDAG architecture of Kaspa allows for much greater scalability, allowing thousands, if not millions, of transactions to be processed simultaneously.(Current consensus mechanism used in kaspa is Phantom GhostDag and 1 block per second eprint.iacr.org , but over the next years they will try to implement the Dag Knight Protocol, eprint.iacr.org and rewrite the codebase from Golang to Rust that will improve the speed to about 32-100 BPS which will make Kaspa much faster and even more scalable than it is today.)
In addition to its scalability, Kaspa is also designed to be highly secure. It utilizes the kHeavyHash algorithm, a modification of the SHA-256 hashing algorithm used in Bitcoin, which allows for high hashing power per watt. This makes Kaspa's proof-of-work system highly energy efficient, while still maintaining the decentralization and security that is inherent to all cryptocurrencies.
Kaspa is also designed to be fully decentralized, meaning that anyone can participate in the network, and all participants have an equal say in the decision-making process. This is in stark contrast to centralized systems, where power is concentrated in the hands of a select few. By remaining decentralized, Kaspa ensures that it remains open, transparent, and resistant to censorship.
Another key feature of Kaspa is its instant transaction confirmation time. The blockDAG architecture allows for transactions to be confirmed almost instantly, providing a much smoother user experience than traditional blockchains. This feature is essential for the widespread adoption of cryptocurrencies as a viable means of payment.
Overall, Kaspa represents a major leap forward in the evolution of blockchain technology. Its unique blockDAG architecture, combined with its scalability, security, and instant transaction confirmation times, make it an incredibly powerful and promising platform for the future of decentralized finance.

Flashcrash alertThe big black swan flash crash is coming now. Sell and leave this market. We gonna hit that 0.09 target in no time


Kaspa MonthlyHere we have the long-term chart for Kaspa. This is the worst month so far.
➖ Notice the blue lines; these are support.
Kaspa is currently trading below both lines, so last months bullish action has been fully nullified.
➖ July's candle closed as a hammer. A bearish signal when showing up at the top of a trend.
This month being red supports the hammer as a reversal signal.
➖ The reversal is the change from uptrend to downtrend.
➖ This month also has the highest volume, bearish, since December 2023.
➖ This project has been very resilient in its price action. Corrections tend to end between 0.618 and 0.786 Fib., but sometimes, like way too many times, they can go much, much lower but this happens mainly with the small projects. This is something to be seen.
➖ At least 0.618 can be expected (to be tested as support).
👉 The good news is that a strong bull-market will follow this current drop we are mapping.
➢ Stay strong.
➢ Or SHORT strong.
➢ I know many experts are always watching this pair.
➢ You can go high gear on this one now.
Thank you for reading and for your continued support.
Namaste.

Get Ready for a Potential 10x Surge: A Moonshot Opportunity!If this asset follows Ethereum's 2017 price trajectory, we could be looking at a massive 10x increase over the next three months. This is an exciting time, as the asset is showing strong potential for significant upward movement. With 85% of the supply already in circulation, the conditions are primed for a major rally. Now is the time to prepare for the big moves ahead—things are looking very promising. Keep an eye on this one; a moonshot could be just around the corner!

KAS. 0.17011. LONGThe token has a very large accumulation. No rollbacks. The buyer holds the price. In case of a breakout of the key level, a good impulse can be expected.

Kasusdt Trading opportunityKAS/USDT has undergone a notable surge, capturing the attention of a lot of traders and alike as it culminates an impressive impulsive Wave 3 within the larger five-wave cycle. Notably, the recent listing of the coin on Binance Futures has stirred some concerns.
The completion of Wave 3 within this broader cycle suggests a phase of heightened momentum and potential further upside towards immediate resistance zone. However, the introduction of the coin to Binance Futures introduces an element of caution.
Despite this listing, the expected cycle completion for KAS/USDT prompts a tempered approach, anticipating the conclusion of its current wave structure before a probable correction phase begins.
The buy back zone is an important zone for buyer to pick more bags, with final target to be around Final setup target.
Your insights and engagement are appreciated to foster a richer discussion on this intriguing market movement. Thank you.

KASPA Nearing Breakout Point
Shifting to a shorter timeframe:
Rising on a bullish trendline, KASPA is making a bullish triangle pattern. If it crosses the breakout point, the take profit will be at $0.2-0.22.
However, to start its bullish trajectory, it must break above the converging EMA (100, 200) on the 4-hour chart.
