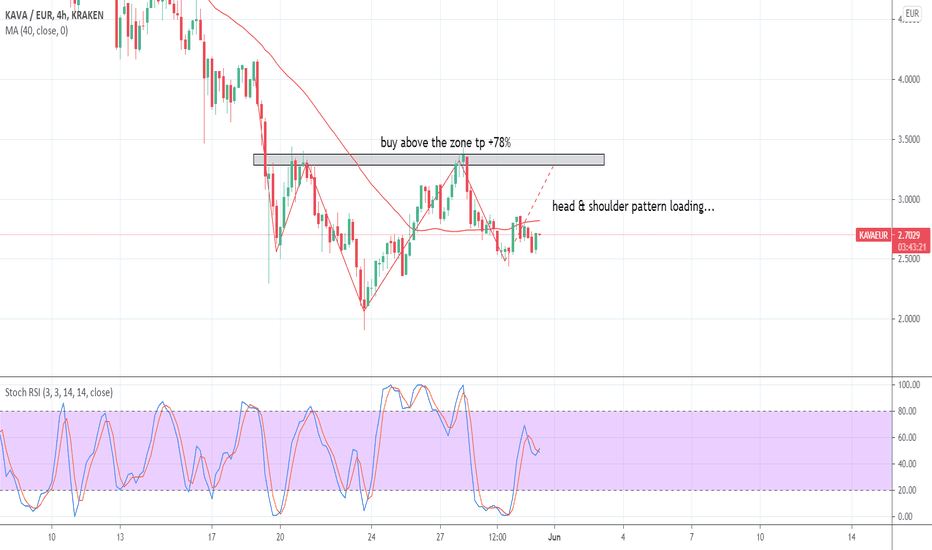
KAVA Bounch or drop moment and levelsDraw some Kava support lines. Signals are not positive.
If we are able to maintain 2.1 support line we can bounch to higher levels. If we loose support of 2.1 we can go to the next lower 3 support levels.
.
.
.
.
.
.
this is not a financial advice. Just my two cents of learning analyzing the waves
Related pairs
KAVAEUR Hello everyone,
During this weekend's pullback of KAVA, it retested the strong daily trendline while not breaking its previous low.
Therefore still keeping an eye on KAVA to continue higher in the upcoming weeks.
I have already entered a trade on KAVA as can be seen on the chart.
Feel free to s
KAVA looks ready for first obstacle. 1D analysisKAVA consolidated quite well over the time and did a double bottom pattern on daily, after the break of the big wedge.
Such price action is a good base for run and I expect slow climbing of KAVA. This is a good SWING trade idea.
Take with risk management! Good luck!
KAVA good entry after break. Retrace to 1.4 with target 2 EURKAVA finally broke the resistance and now is showing some nice movement. I waited carefully for retrace and I am ready to enter in the range of 1.4-1.45
Once big concern is whether BTC is about to correct or now. Anyway my SL below 1.35 is for that reason.
It already retraced near the entry point ~
KAVA 1D Chart - breaking out of the current formationKAVA is doing great and it breaks the current formation at ~1.75 EUR. The coin is worth holding for a while to see what it could do but the minimum resistance I see is 2 EUR.
The pattern looks like big Falling wedge and after retrace I will look for trade opportunity. For just holders good to keep t
KAVA - Retrace in bear leg / Technical double bottom at 1.5 EURKAVA is in a really good place for small retrace as technically we reached double bottom at ~1.5 EUR. The target is around 1.7 EUR. The SL should be around 1.47 EUR. Overall this is a very good R2R place to open long with SL of course.
Why now?
1. KAVA went down with nearly 17% and that is another
KAVA - good R2R trade if resistance line breaks (LONG)KAVA has a very good R2R trade idea. Currently they are 3 main patterns which mix in different timeframes.
1) In 1D KAVA is in big H&S pattern and "blue" line in chart is the resistance zone. IF this breaks will be the best scenario.
2) On 4 HRs frame we have a good trendline which holds the curren
See all ideas
Summarizing what the indicators are suggesting.
Oscillators
Neutral
SellBuy
Strong sellStrong buy
Strong sellSellNeutralBuyStrong buy
Oscillators
Neutral
SellBuy
Strong sellStrong buy
Strong sellSellNeutralBuyStrong buy
Summary
Neutral
SellBuy
Strong sellStrong buy
Strong sellSellNeutralBuyStrong buy
Summary
Neutral
SellBuy
Strong sellStrong buy
Strong sellSellNeutralBuyStrong buy
Summary
Neutral
SellBuy
Strong sellStrong buy
Strong sellSellNeutralBuyStrong buy
Moving Averages
Neutral
SellBuy
Strong sellStrong buy
Strong sellSellNeutralBuyStrong buy
Moving Averages
Neutral
SellBuy
Strong sellStrong buy
Strong sellSellNeutralBuyStrong buy
Displays a symbol's price movements over previous years to identify recurring trends.


