baby baby KAVAlook how lovely this triangle is! I longed the dip near the trendline! lets see whats gonna happen! big gainssssss
Related pairs

Kava: 5 Strong Bullish Signals, Cup & Handle, High Volume & MoreThe cup & handle pattern doesn't work at resistance. You cannot use this pattern in any meaningful way at the top of a rising trend. For the C&H to be valid, it needs to happen at the end of a downtrend, near the market bottom because this is a bullish reversal pattern.
Here we have KAVAUSDT weekly

$KAVA breaking out of its defending phase to 4$ I would like to notice as the market picks up for Monday I think this is a great risk to take here.
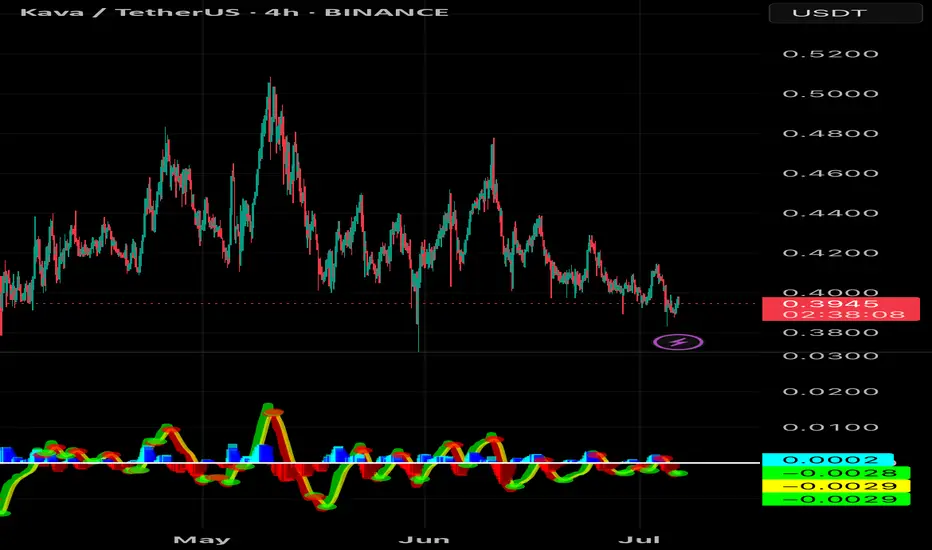
KAVA LONG on a .039 - .038 entry leading into a breakout above its previous drawback.
4hr chart looks depressing but MACD shows sign of health. Holding a 20x leverage position here and hoping we c
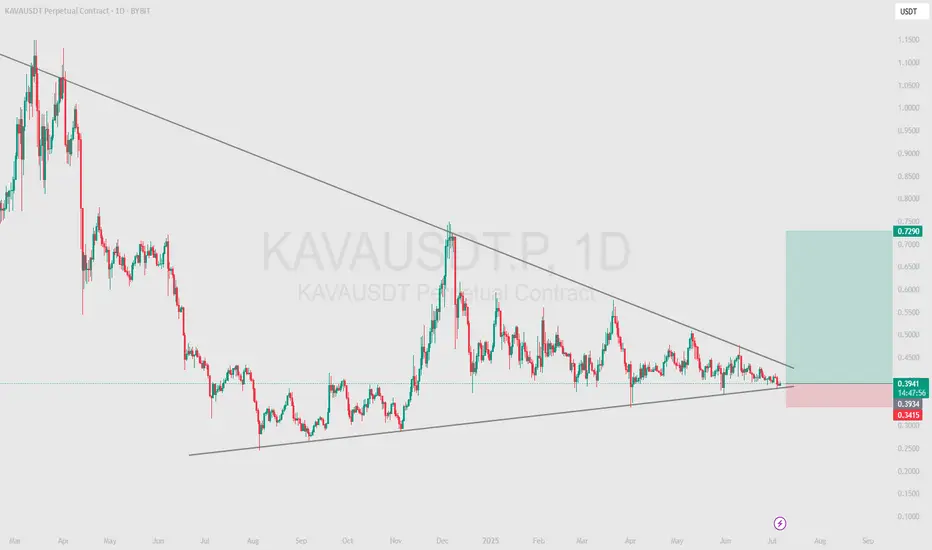
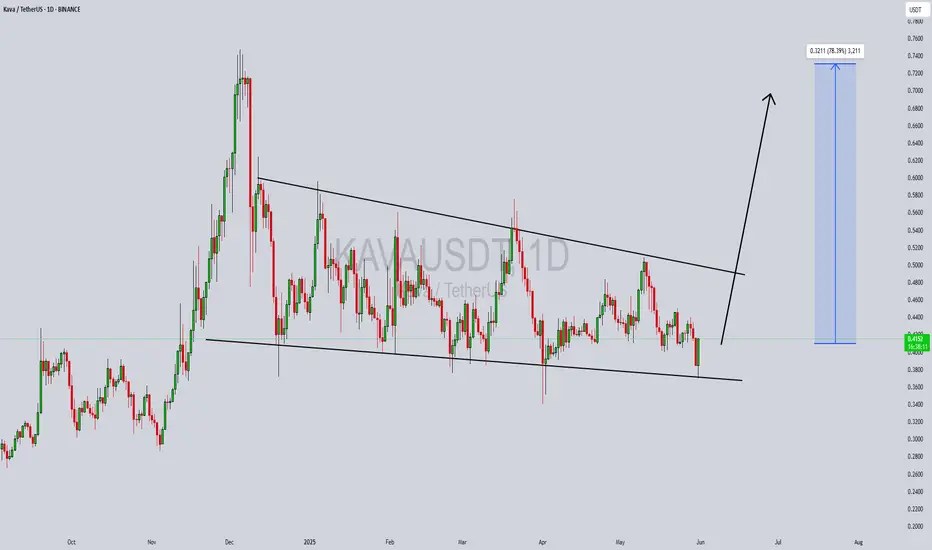
KAVA - We are expecting the rocket at 80%The KAVAUSDT chart shows a clear downward channel, indicating a bearish trend. However, the price is currently consolidating around the middle of the channel, creating uncertainty about the immediate direction.
Recommended signal: wait for confirmation of a breakout above the upper boundary for lon
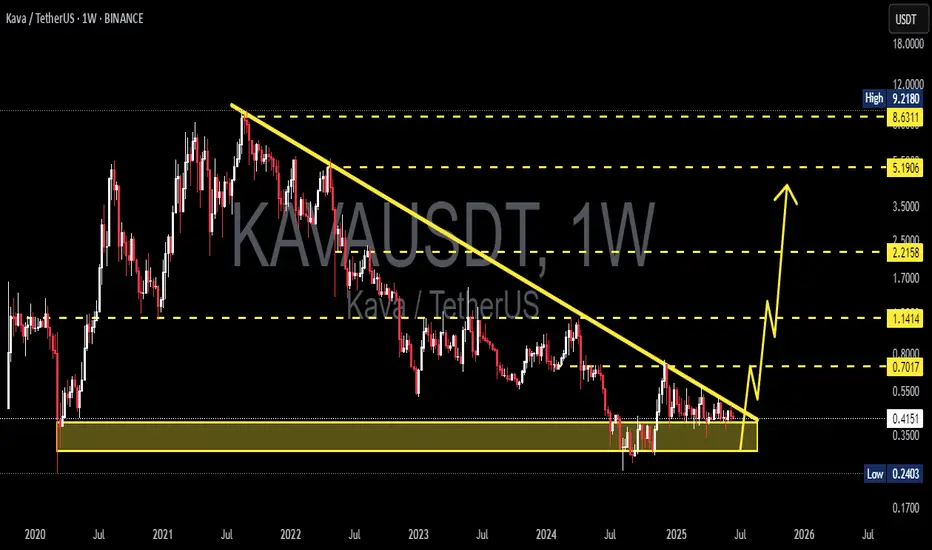
Is KAVA/USDT About to Explode? Major Breakout Incoming!Technical Analysis (Timeframe: 1W - Weekly)
1. Descending Triangle Breakout Setup
KAVA has been in a prolonged downtrend since 2021, forming a large descending triangle pattern. Currently, the price is nearing the apex of this formation, signaling a potential breakout in the near term.
2. Strong A

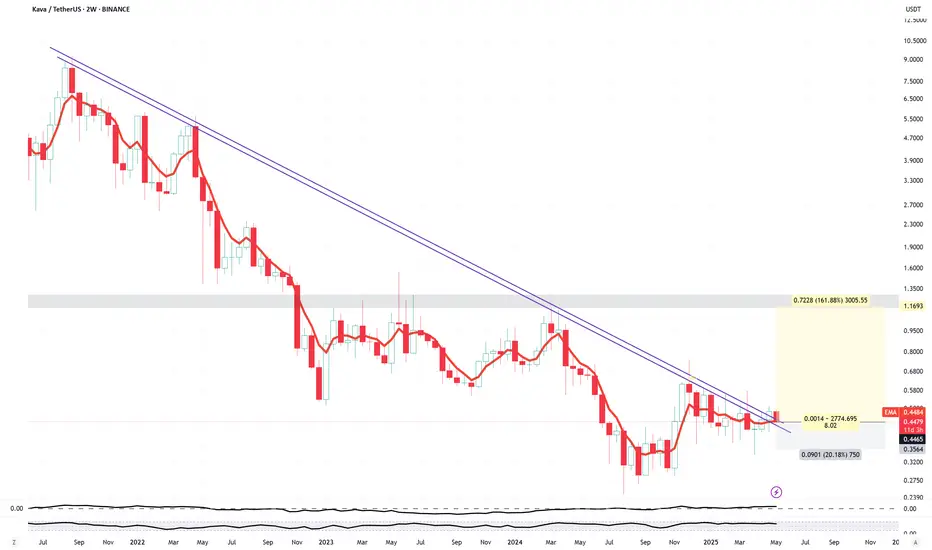
KAVAUSDT 1W AnalysisKAVA ~ 1W Analysis
#KAVA This is the lowest support block for now. Buy from here if you still have faith in this coin with a short term target of at least 15%++
Buy KAVAKava is a decentralized finance (DeFi) platform built on the Cosmos blockchain, designed to offer a wide range of financial services, including lending, borrowing, and staking. Known for its interoperable network architecture, Kava enables users to access various DeFi services in a highly secure, sc
KAVAUSDT | Potential Long | POC Support | (June 5, 2025)KAVAUSDT | Potential Long | POC Support + Daily Money Flow Shift | (June 5, 2025)
1️⃣ Insight Summary:
KAVA is currently trading below the value area low and near the Point of Control (POC), suggesting a key decision zone. Despite short-term weakness, the daily money flow is starting to turn positi

Kava : Day trade volumeKava can show new volume on day trade volume. We will follow this coin in the coming time frames for the uptrend.

KAVAUSDT Forming a Bullish WaveKAVAUSDT is currently presenting a strong bullish wave pattern formation on the daily timeframe, hinting at a potential continuation of the upward trend. After a period of consolidation, KAVA has started to push higher with increasing bullish momentum. This movement is accompanied by solid volume, s
See all ideas
Summarizing what the indicators are suggesting.
Oscillators
Neutral
SellBuy
Strong sellStrong buy
Strong sellSellNeutralBuyStrong buy
Oscillators
Neutral
SellBuy
Strong sellStrong buy
Strong sellSellNeutralBuyStrong buy
Summary
Neutral
SellBuy
Strong sellStrong buy
Strong sellSellNeutralBuyStrong buy
Summary
Neutral
SellBuy
Strong sellStrong buy
Strong sellSellNeutralBuyStrong buy
Summary
Neutral
SellBuy
Strong sellStrong buy
Strong sellSellNeutralBuyStrong buy
Moving Averages
Neutral
SellBuy
Strong sellStrong buy
Strong sellSellNeutralBuyStrong buy
Moving Averages
Neutral
SellBuy
Strong sellStrong buy
Strong sellSellNeutralBuyStrong buy
Displays a symbol's price movements over previous years to identify recurring trends.
Frequently Asked Questions
The current price of KAVA / USDT Spot Trading Pair (KAVA) is 0.3868 USDT — it has fallen −0.62% in the past 24 hours. Try placing this info into the context by checking out what coins are also gaining and losing at the moment and seeing KAVA price chart.
KAVA / USDT Spot Trading Pair price has fallen by −0.46% over the last week, its month performance shows a 6.05% increase, and as for the last year, KAVA / USDT Spot Trading Pair has decreased by −1.73%. See more dynamics on KAVA price chart.
Keep track of coins' changes with our Crypto Coins Heatmap.
Keep track of coins' changes with our Crypto Coins Heatmap.
KAVA / USDT Spot Trading Pair (KAVA) reached its highest price on Dec 5, 2024 — it amounted to 0.7487 USDT. Find more insights on the KAVA price chart.
See the list of crypto gainers and choose what best fits your strategy.
See the list of crypto gainers and choose what best fits your strategy.
KAVA / USDT Spot Trading Pair (KAVA) reached the lowest price of 0.2861 USDT on Nov 4, 2024. View more KAVA / USDT Spot Trading Pair dynamics on the price chart.
See the list of crypto losers to find unexpected opportunities.
See the list of crypto losers to find unexpected opportunities.
The safest choice when buying KAVA is to go to a well-known crypto exchange. Some of the popular names are Binance, Coinbase, Kraken. But you'll have to find a reliable broker and create an account first. You can trade KAVA right from TradingView charts — just choose a broker and connect to your account.
Crypto markets are famous for their volatility, so one should study all the available stats before adding crypto assets to their portfolio. Very often it's technical analysis that comes in handy. We prepared technical ratings for KAVA / USDT Spot Trading Pair (KAVA): today its technical analysis shows the strong sell signal, and according to the 1 week rating KAVA shows the sell signal. And you'd better dig deeper and study 1 month rating too — it's strong sell. Find inspiration in KAVA / USDT Spot Trading Pair trading ideas and keep track of what's moving crypto markets with our crypto news feed.
KAVA / USDT Spot Trading Pair (KAVA) is just as reliable as any other crypto asset — this corner of the world market is highly volatile. Today, for instance, KAVA / USDT Spot Trading Pair is estimated as 6.83% volatile. The only thing it means is that you must prepare and examine all available information before making a decision. And if you're not sure about KAVA / USDT Spot Trading Pair, you can find more inspiration in our curated watchlists.
You can discuss KAVA / USDT Spot Trading Pair (KAVA) with other users in our public chats, Minds or in the comments to Ideas.