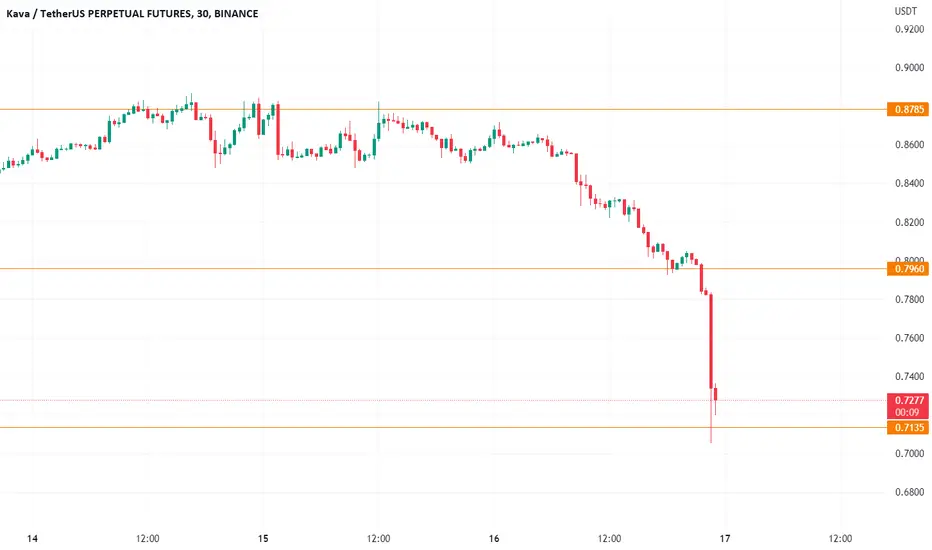
KAVAUSDTPERP Support and resistance UpdateAs you can see, after breaking 0.7135 and reaching 0.7000, the price was able to regain this level again, but it could not move far from this level and lost this level again, but it regained this level. It is now above this level.
KAVAUSDT trade ideas

KAVAUSDT - The triangle ContinuedYou can find information on the Internet on how to work this triangle.
I will wait for the confirmation of the signal.
The main entry point is a breakout of a trend line or level.
An alternative option if crypto will not be drained
prnt.sc
Last idea

KAVAUSDTPERP Support and resistancePrice support and resistance are marked on the chart for the symbol.
KAVA Price predictionHi everyone,
I will appreciate for ur activity. Thank you!
Looks like we are in triangle, but i wanna see upward movement with retest atleast 1$ zone, in any case stop-loss is short, gl
Targets: 0.96 - 1 - 1.06
Stop: ~0.8
RR: 1 to 3
I hope my work suits you and you are satisfied.
DYOR!

kavausdt - flat bottom triangle in growth!!!The monthly candlestick is straight-up scary.
Opening a new candle will pull the price up.
So waiting for the upside.
I wish I could find a long scenario on the 1 hour and even better on the 5 minutes.
Let's go down to the daily chart. We see a pullback at the monthly low.
At the hour chart, we see the break with the return to the zone and strong growth to the upper border of the bear trend (red line)
And if it breaks through the support we'll see a price -50% discount.
What are your thoughts, friends?

#KAVAUSDT 4H Chart
Price has tapped into the 4h demand zone where it bounced from exactly as expected. MACD is not clear, RSI and EMAs are both neutral. We should now see further bullish movements aiming to create a new higher high.

#KAVAUSDT 4H Chart
Price has bounced from the 8h demand zone exactly as predicted and left another 4h demand zone on its way up around $0.84. MACD is showing some bullish weakness, RSI and EMAs are neutral. I expect price to move back down towards this 4h demand then continue its overall upward movements from there.

KAVA USDT, binance futuresKava has to pump according to old trend, let btc help kava a bit then .94 target for kava is easy within a week.

#KAVAUSDT 4H Chart
Price liquidated the support line and reached the 8h demand zone as predicted where it bounced from. MACD is showing bearish weakness, RSI is sold and EMAs are turning bearish. I am still waiting for lower timeframe confirmation before expecting price to move up from here aiming to create a new higher high.

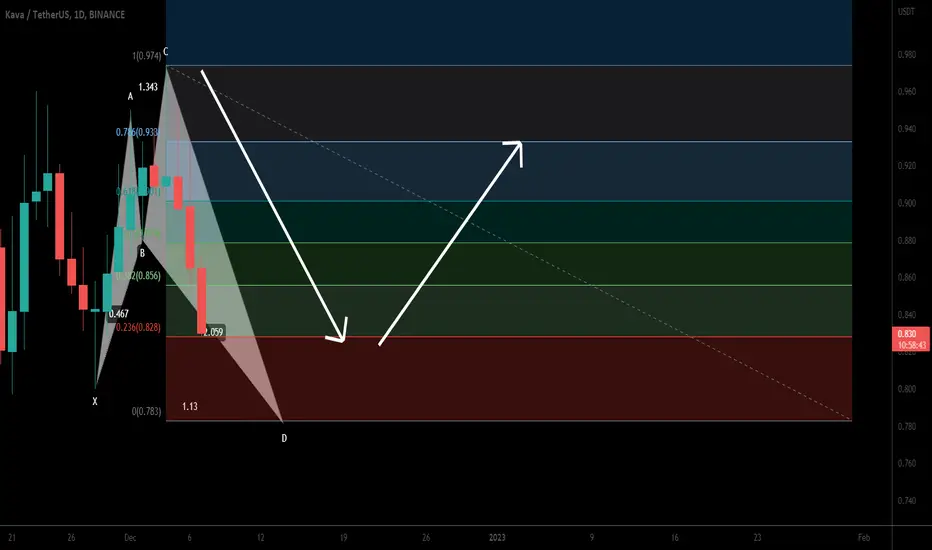
Kava. io forming a bullish Shark for upto 19% pumpHi dear friends, hope you are well and welcome to the new trade setup of Kava. io (KAVA) token with US Dollar pair.
On a daily time frame, KAVA is about to complete a bullish harmonic Shark move.
Note: Above idea is for educational purpose only. It is advised to diversify and strictly follow the stop loss, and don't get stuck with trade
KAVA - TIME TO GROWHello traders,
Based on the chart, we have potentially good setup with short stop-loss and good Risk/Reward ratio.
Targets: 0.97 - 1.05 - 1.15
after first target reached move ur stop in breakeven!
SL: ~0.805
Risk/Reward: 1 to ~5
Good luck!
Please, feel free to share your point of view, write it in the comments below, thanks!

KAVAUSDTPERPJust a simple analysis,
harmonic patterns, trendline, triple bottom, potential reversal.
BINANCE:KAVAUSDTPERP

KAVA analysisPrice is still moving in an uptrend respecting a support line also creating liquidity. I expect price to break below this support line and move down reaching the 8h demand zone around $0.83 where we would be looking to long from.


$KAVAUSDT UPDATE!!!Hi Snipers,
Please refer to the recording for the next price levels and scenarios.
Thanks
MS

its time to long KAVA........BINANCE:KAVAUSDT
maxRECORDS (Future Trading)
LONG | KAVA
Entry : 0.85
Take Profit
0.90 - 0.91 - 0.92 - 0.93
Stop Loss
0.79
Cross 20x
For More Signals
Please Follow My Account.....

KAVAUSDT | APPROACHED TO SUPPORTKAVAUSDT has been trading in a bearish trend . The price has been making lower lows and lower highs.
Now after breaking some major support, price has approached to strong horizontal support zone .
The price has printed bullish divergence on RSI too.
. The bulls can take control from here.
Manage your levels accordingly.

KAVAUSDT is testing the key level
The price is testing the daily resistance above the monthly support
How to approach it?
IF the price is going to lose the current support and retest it as new resistance, According to Plancton's strategy , we can set a nice order
–––––
Keep in mind.
🟣 Purple structure -> Monthly structure.
🔴 Red structure -> Weekly structure.
🔵 Blue structure -> Daily structure.
🟡 Yellow structure -> 4h structure.
⚫️ black structure -> <= 1h structure.
–––––
Follow the Shrimp 🦐

$KAVAUSDT UPDATE!!!Hi Snipers,
Please refer to the recording for the next price levels and scenarios.
Thanks
MS

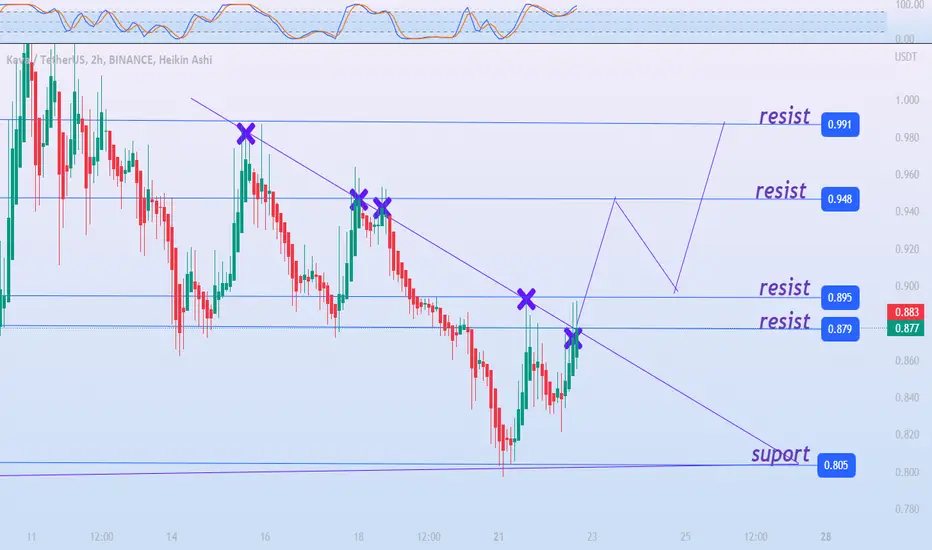
KAVAUSDT The above graph of Kava (KAVA) shows a triangle pattern. This pattern is being broken as the graph shows. The oversold indicated by the RSI may push the price of KAVA towards 0.852. It follows its supports and resistances.
Supports: 0.852 / 0.805
Resistances: 0.895 / 0.948 / 0.991
Kava (KAVA) Price Prediction 2022 Kava (KAVA) Price Prediction 2022
Kava (KAVA) holds the 106th position on CoinGecko right now. KAVA price prediction 2022 is explained below with a daily time frame.
The above chart of Kava (KAVA) laid out a descending triangle pattern. This pattern is often regarded as a characteristic of a bearish trend. It is formed by the upper trend line that connects the highs and a horizontal trend line connecting lows converges to form a triangle. If the price action breaches the lower support level, the bearish trend would be sustained.
Generally, a descending triangle pattern indicates the reversal of an uptrend or the continuation of the downtrend. Traders keenly look out for a significant breakout point.
Currently, Kava (KAVA) is at $0.878. If the pattern continues, the price of KAVA might reach the resistance level of $1.076 . If the trend reverses, then the price of KAVA may fall to $0.797
Happy Trading

Kava. io formed bullish BAT | A good buy opportunityHi dear friends, hope you are well and welcome to the new trade setup of Kava. io (KAVA) token with US Dollar pair.
Previously after reaching the sell zone, the priceline moved down:
Now on a 4-hr time frame, GTC is about to complete the final leg of a bullish Gartley pattern.
Note: Above idea is for educational purpose only. It is advised to diversify and strictly follow the stop loss, and don't get stuck with trade

KAVA - Possible inverse head and shoulders (Risky)Possible long formation on KAVA as recent price action is showing an inverse head and shoulders pattern and price recently broke out from a descending trendline with decent volume action
Possible long setup
BUY: CMP
TP: $1.0095-1.0391-1.0668-1.1111-1.1649
SL: $0.955
