kavausdt 1d daily resistane trend line is broken now we see HH and going up if you take a long positoin do make sure to put your stoploss trand carefully
KAVAUSDT trade ideas

Kava with the lava! If the bulls can keep our momentum going, kava will explode after cross lines showed.
If not, more accumulation.
Oh and also guys, more accumulation only means be a little more patient on investments. This isn’t the casino!
DYOR! Trade safely.

Gnarly Long KAVAA pretty gnarly trade suggestion and not the cleanest with stop-loss placement.
We are above the cloud on the 1 hour and also higher time frames like the 12 hour. (along with the lagging strand). Almost looking for a continuation of the prevailing up trend.
In terms of stop-limit placement, it might be a bit of grin and bare it. Only smaller positions. The gains could be as equally big as the losses though.
A sensible trailing stop-limit could be the Parabolic SAR on the 1hour.

$KAVA Longggcurrently the strongest holding coin.
Pump is highly expected. Making a strong bull flag
Cheers,
nav

KAVA rejected from important zonekava in trading range in daily and 4hr timeframe ,i expect kava tuch bottom of trading range , make sure comment below your idea ...PEACE
Kava!!!As you can see in my chart,kava has formed a disjoint channel and in the middle of this channel we have a support line


KAVAUSDT 6H TA: PRZ zone As we can see in the chart, the price jumped upwards when it hit the prz area, and we expect to correct the $ 5.5 area when it hits. So it is suggested to save profit. And re-enter if the $ 5.5 range is broken above. We expect a drop to $ 4.2 if corrected.
Its not Buy or Sell SIGNAL
DYOR
BY : Mohamad Teriz - @AtonicShark


KAVAUSD H16: 200% gains XABCD BEST LEVEL TO BUY(SL/TP)(NEW)Why get subbed to me on Tradingview?
-TOP author on TradingView
-2000+ ideas published
-15+ years experience in markets
-Professional chart break downs
-Supply/Demand Zones
-TD9 counts / combo review
-Key S/R levels
-No junk on my charts
-Frequent updates
-Covering FX/crypto/US stocks
-before/after analysis
-24/7 uptime so constant updates
🎁Please hit the like button and
🎁Leave a comment to support our team!
KAVAUSD H16: 200% gains XABCD BEST LEVEL TO BUY(SL/TP)(NEW)
IMPORTANT NOTE: speculative setup. do your own
due dill. use STOP LOSS. don't overleverage.
IMPORTANT NOTE: always do your own due dill.
not financial advice.
🔸 Summary and potential trade setup
::: VETUSDT 16hour/candle chart review
::: new setup based on XABCD patter
::: still great setup for 170% gains
::: updated / revised / more realistic scenario
::: break below current cycle low at 3.00 USD
::: expect actual low point C at 2.55 USD
::: at point C / so it's cycle low soon
::: speculative XABCD setup in progress
::: BULLS BUY after PULLBACK near 2.55 USD
::: from my level TP +170% gains
::: this is BUY/HOLD setup
::: patient traders only
::: not for gamblers
::: SPECULATIVE SETUP
::: do your own due dill
::: and use proper risk management
::: TP bulls is +170% gains USD
::: details: see chart
::: FINAL TP +170% gains point D
::: recommended strategy: BUY/HOLD
::: SWING TRADE: BUY/HOLD IT 2.55 USD
::: final TP BULLS is 6.55 USD
::: bull run not over yet
::: good luck traders!
::: BUY/HOLD and get paid. period.
🔸 Supply/Demand Zones
::: N/A
::: N/A
🔸 Other noteworthy technicals/fundies
::: TD9 /Combo update: N/A
::: Sentiment mid-term: BULLS/PUMP/point D
::: Sentiment short-term: BEARS/PULLBACK/point C
RISK DISCLAIMER:
Trading Crypto, Futures , Forex, CFDs and Stocks involves a risk of loss.
Please consider carefully if such trading is appropriate for you.
Past performance is not indicative of future results.
Always limit your leverage and use tight stop loss.

KAVA/USDT about to breakout-TA
Kava / usdt after successful retest is not Dumping in this bad market. Tps are given Hopefully it will hit those
-FA
kava/usdt mainnet launch on may 05 and many other events in may aswell

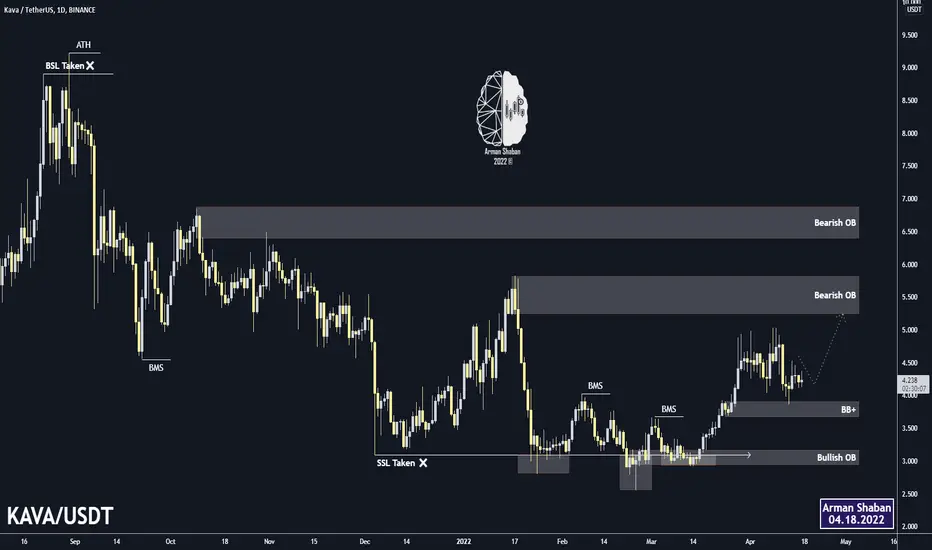
KAVA : Daily TA : 04.18.22 (IO)Technical analysis of #KAVA 's chart and its appealing ranges . Let's take a look at some of the high-potential cryptocurrencies in the market for investment, as you can see all the supports, resistances, targets, etc. are marked on the chart. Pay special attention to the specified levels that i mentioned in the chart . I think everything is obvious in the chart , but just in case if you had any questions pls feel free to ask .
Follow us for more analysis & Feel free to ask any questions you have, we are here to help.
⚠️ This Analysis will be updated ...
👤 Arman Shaban : @ArmanShabanTrading
📅 04.18.2022
⚠️(DYOR)
❤️ If you apperciate my work , Please like and comment , It Keeps me motivated to do better ❤️
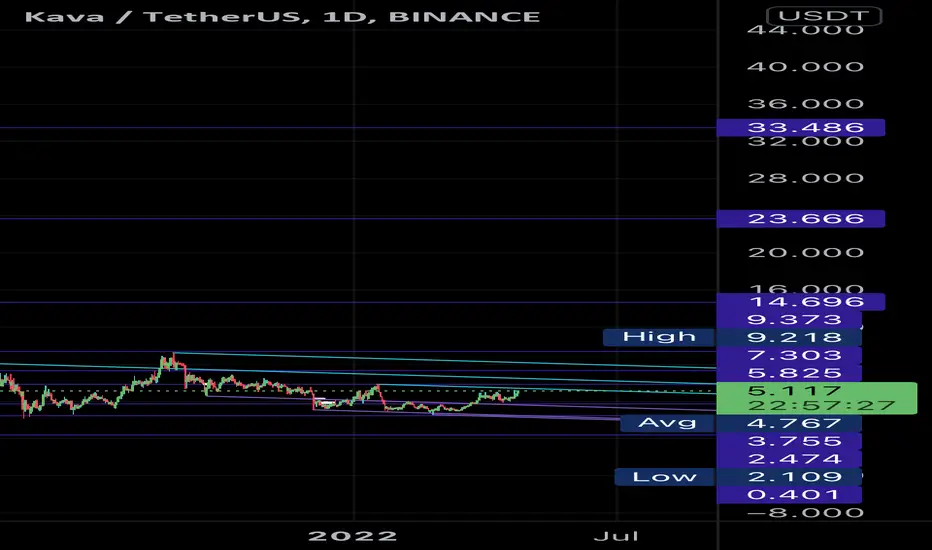
KAVA.USDT (Y21.P5.E1).Macro TargetHi Traders,
I'm doing a series of posts looking for the new price discovery top based on structure, fib and previous history.
Kava has no history except the recent all time high.
With the assumption BTC is also going to do ATH, we will forecast in this perspective.
I have 2 models, standard and parabolic. Parabolic model requires certain events to happen before its valid, too early at this point.
The first is the parabolic model as the main post with the 1st as the main target.
The standard is below.
All the best,
S.SAri

Kava (KAVA): Bearish OutlookIn my recent post, I have drawn a bearish outlook for Bitcoin. Hence, it's fair to re-evaulate my EW count on some previous posts. It should be noted that I'm by no means an expert on EW analysis, so any feedback would be much appreciated.
For Kave I made some slight EW adjustments and some dubious speculation on where this altcoin may bottom. In my view, Kava might still be correcting on a larger degree (intermediate): double three (WXY) or even a tripple three (WXYXZ). Wave X already made a 50% retracement of Wave W and it looks like we are heading down for Wave Y. Whether Wave Y will present itself as a double three, a zigzag, a flat, or a triangle is to be determined.
If Wave Y = 100% of Wave W, this correspond with a 50% retracement in Wave 2 (Primary) and could lead to a price target of $1.48.
-If you agree with this, like and share.
Cheers.

KAVA 01 Apr by PPRKjust wait one more deep price.
Long entry area: 4.23 - 4.31
TP: 4.46 - 4.53 - 4.65 - 4.82 - 5
SL: 3.98

KAVAUSDTHEY GUYS there is a low risk position for buy.completing the pullback to the broken trend-line and is in the support range.
If this post was useful to you, support us by liking and commenting

KAVAUSDT TECHNICAL ANALYSIS Risk/Reward Ratio is 1.6 and the candle open close above to down trendline. Meaning the candles already leave from triangle. We have received multiple signals from our robo advisor @EngineeringRobo as well. We may earn approximately 11% if candle stay above to up trend-line.
Let’s follow our chart closely and do not forget to follow me as well.
“NFA”

KAVA Price Targets and Stop LossKAVA/USDT
Entry Range: $4.50 - 4.80
Take Profit 1: $5.10
Take Profit 2: $5. 65
Take Profit 3: $6.50
Stop Loss: $4.00

KAVA morning scalpGM friends, we had a picture perfect scalp yesterday with $KAVA and $NEAR - looking at the chart (and weekend..), Im willing to scalp again. The setup is very simple and requires minimum attention due to clear invalidation on upper level. Have a look and share some love if you like.

$KAVA ready for upside?Hey, looking at $KAVA, which had a decent run, approaching heavy resistance. We either smash the resistance (not likely due to weekend low vol.) or we pullback, which Im following with an breakout short (as indicated)

KAVA BUY SIGNAL$KAVA BUY SIGNAL
$KAVA has reclaimed above the resistance trendline on daily TF with bullish run. The three MA are below the price action with 7MA and 100MA birthed Golden Cross. Our Fibbo printed 0.238.Successfully the Bullish broke through the dotted resistance I setted last night. and since the broken up, it has printed 2.5%. Send it up-#Gbera
-Buy Area: $4.6 - $4.9. You can surely buy at the spot. My personal target is 95% profit
-Sell Area : TP1-$5.8, TP2- $6.4, TP3-$8.6 . Better still, you can drop the bag from $6 above
Ebino
#DYOR

KAVA/USDTPERP LONG IDEAAnalysis are detailed on the chart, always confirm an ltf reversal structure in our POI before entering.
