KAVA Technical Analysis in a Weekly TimeframeHello everyone, I’m Cryptorphic.
I’ve been sharing insightful charts and analysis for the past seven years.
Follow me for:
~ Unbiased analyses on trending altcoins.
~ Identifying altcoins with 10x-50x potential.
~ Futures trade setups.
~ Daily updates on Bitcoin and Ethereum.
~ High time frame (HTF) market bottom and top calls.
~ Short-term market movements.
~ Charts supported by critical fundamentals.
Now, let’s dive into this chart analysis:
Since August 2021, KAVA has been in a downtrend and is now close to an all-time low. There has been no significant growth, and the current price range seems to be a dead end.
If KAVA doesn't manage to recover, we could see a new all-time low and a price discovery phase toward the downside.
In my opinion, KAVA should respect this ATL support, rebound by breaking above the resistance trendline, and start a bullish rally. The RSI is in the oversold zone, indicating a potential bullish move.
Key levels:
- Important Support/Accumulation: $0.2403
- Primary Resistance: $0.558
- Long-term Target: 10x-20x
DYOR, NFA
Please hit the like button to support my content and share your thoughts in the comment section. Feel free to request any chart analysis you’d like to see!
Thank you!
#PEACE
KAVAUSDT trade ideas

Kava long road to 6$BINANCE:KAVAUSDT
Kava personally for me underrated now. 100% coins in circulation supply only 1b
Possible Targets and explanation idea
➡️Weekly tf, trade around 27 accumulation block
➡️Jan 2023 got main signal to buy on W based on Trade on indicator
➡️Trade around buy line on take profit indicator
➡️Road to 6B market cap and sweep EqHigh Jan-Apr 2022
➡️Money inflow on Weekly tf on money power indicator and MACD div like confirmation
➡️ Main targets for bull run I think way higher 6b market cap
Hope you enjoyed the content I created, You can support with your likes and comments this idea so more people can watch!
✅Disclaimer: Please be aware of the risks involved in trading. This idea was made for educational purposes only not for financial Investment Purposes.
---
• Look at my ideas about interesting altcoins in the related section down below ↓
• For more ideas please hit "Like" and "Follow"!

KAVA (Kava.io): Approaching ResistanceTrade setup : Price remains in a downtrend, trading well below 200-day moving average. It had a bearish breakout from Falling Wedge pattern and dipped as low as $0.32, making a new 52-week low. It bounced from very oversold levels (RSI < 25!) near that $0.32 support and is approaching $0.42 resistance now, where it's likely to get rejected and revisit $0.32. It's too early to tell if this is a sign of trend reversal or just a bounce in a downtrend.
Pattern : Price is Approaching Resistance , which is a level where it could pause or reverse its recent advance, at least temporarily. Resistance is often a level where price got rejected in the past, or potentially prior Support level that was broken. (concept known as polarity). Once price breaks above resistance, it can advance higher to the next resistance level. Learn to trade key levels in Lesson 7.
Trend : Short-term trend is Strong Down, Medium-term trend is Strong Down and Long-term trend is Strong Down.
Momentum : Price is neither overbought nor oversold currently, based on RSI-14 levels (RSI > 30 and RSI < 70).
Support and Resistance : Nearest Support Zone is $0.32. Nearest Resistance Zone is $0.42, then $0.55.

Kava to BuyKava have broken out of its downwards trend. a potential buy call can be taken at around 0.4000. for target price of 0.4200 and stoploss would be 0.3950

Wyckoff Spring on the works...Morning fellas,
Market really pushing some buttons lately.
Two things:
1) I hope you have not sold at a loss.
2) I hope you have had money to buy these drops as I believe it's still time to accumulate long term.
With that being said, I think we could still drop and maybe stop hunt the lows 25 cents.
I'll be adding more there.
Trade thirsty, my friends.

descending channel chart Analysis on KAVA/USDT
Pattern Formation
The chart shows several critical patterns:
- Descending Channel: The blue lines indicate a descending channel, which typically suggests a bearish trend continuation.
Volume Profile Analysis
- High Volume Nodes: High trading volume is present around the 0.4340 resistance level, suggesting strong selling pressure at this point.
Price Action Analysis
1. Top Right (1-Month Candle Chart):
- Trend: The monthly chart shows a consistent downtrend with recent strong bearish candles.
- Candlestick Patterns: The last few monthly candles show lower highs and lower lows, reinforcing the bearish trend.
2. Mid Right (2-Week Candle Chart):
- Trend: The 2-week chart continues to show a bearish trend, with the price making lower highs and lower lows.
- Candlestick Patterns: The recent candles are predominantly red, confirming the ongoing selling pressure.
3. Bottom Right (Weekly Candle Chart):
- Trend: The weekly chart indicates a downward trend, with recent candles showing strong bearish momentum.
- Candlestick Patterns: The mixed red and green candles in the latest weeks suggest some consolidation within the overall downtrend.
Disclaimer
This analysis is provided for informational purposes only and should not be considered financial advice. Trading financial instruments involves risk, and you should perform your own research and analysis before making any investment decisions. Always consult with a professional financial advisor.

KAVAUSDT.1DAnalyzing the daily chart for KAVA/USDT, we see a number of technical indicators that provide insights into the asset's recent performance and potential future movements.
Price Action: KAVA/USDT is currently trading near the 0.6135 level, having recently tested and bounced off a support level around 0.5002. This support zone is critical as it prevented further downside several times in the past, which suggests strong buyer interest at this level.
Resistance Levels: On the upside, the immediate resistance levels are marked at R1 (0.8319) and R2 (1.1651). The asset has struggled to break the R1 level since early 2024, indicating a strong selling presence. Overcoming this could lead to a test of R2, which has not been touched since late 2023.
Moving Average Convergence Divergence (MACD): The MACD line is slightly below the signal line, and both are trending below the zero line, which generally suggests bearish momentum. However, the MACD histogram, currently showing smaller bars, hints at decreasing negative momentum.
Relative Strength Index (RSI): The RSI is hovering around 39.53, which is near the oversold territory but not quite there yet. This suggests that there might still be room for downside if selling pressure continues, although it's also close to levels where we might expect buying interest to reemerge due to perceived undervaluation.
Volume and Volatility: The chart does not explicitly display volume and volatility, but these factors would typically provide additional context, especially around key price movements and resistance/support tests.
Conclusion:
Based on the current technical setup, KAVA/USDT is in a critical juncture. If it holds the support around 0.5002, there could be potential for a rebound towards 0.8319, especially if broader market sentiment improves. However, traders should watch for any further weakening indicated by MACD and RSI, which could lead to a breakdown below support. Given the bearish bias indicated by MACD and the proximity of RSI to oversold conditions, a cautious approach is advisable. Setting stop-loss orders just below the current support level might protect against unexpected downturns, while aiming for R1 as an initial profit target makes sense from a risk-reward perspective.


KAVA Analysis: Navigating the Range🔍Bitcoin's dominance is creating market uncertainty, resulting in low volatility for many altcoins, including KAVA. KAVA is a project within the Cosmos ecosystem, known for its significant staking activity, leading to smoother price movements.
📆 Coin of the Day: KAVA
About the Project
KAVA is a project within the Cosmos ecosystem, known for its significant staking activity which leads to lower volatility and smoother price movements.
🧩 Technical Analysis
4-Hour Timeframe
This analysis focuses on futures trading, examining different scenarios.
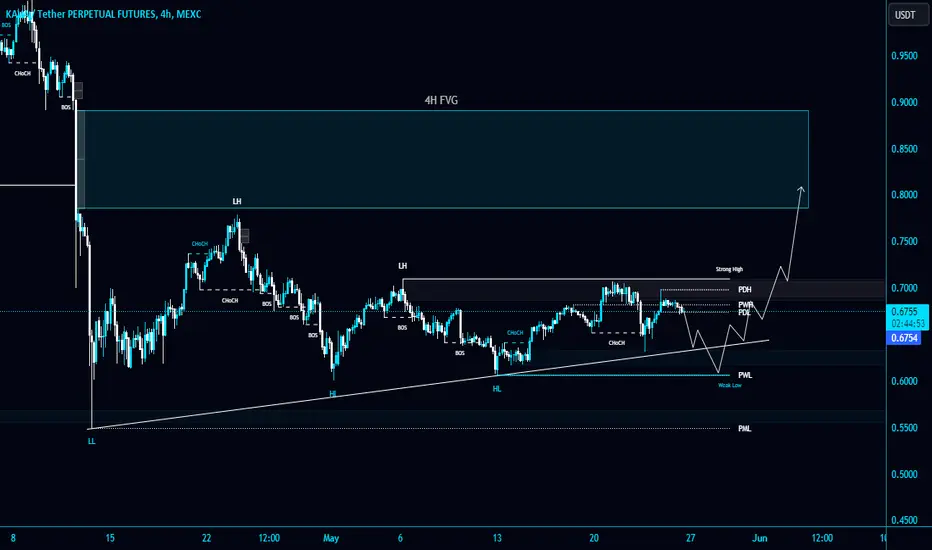
♟ Support and Resistance: KAVA has primary support at 0.6216 and primary resistance at 0.7036. The major resistance level is at 0.7725, while a significant support level is at 0.6216. The market is currently ranging between 0.7036 and 0.6495, making it challenging to trade within this range due to the fixed range volume profile.
📉 Bearish Scenario: If the price breaks below 0.6216, the next bearish target is 0.5572. This level becomes significant for confirming a new bearish phase.
📈 Bullish Scenario: If the price breaks above 0.7036, we can look for a target at 0.7725. Confirmation of bullish momentum would be crucial for entering a long position.
📊Volume Analysis
The volume is currently ranging with a slight sell momentum. Significant buy volume is needed to break the resistance levels, and increased sell volume is required to break the support levels.
👨💻 Trading Positions
🪄Long Position
Primary Entry Trigger: Break above 0.7036
Strategy: Open a position on the break of 0.7036 and wait for confirmation from the price to set the target at 0.7725. Consider taking partial profits at 0.7725 and adjusting stop loss to entry.
💣Short Position
Primary Entry Trigger: Break below 0.6216
Strategy: Open a position on the break of 0.6216 as this is a very critical level in the market. Target the next support at 0.5572. Adjust stop loss based on price action.
📝 Summary: KAVA is currently ranging within key support at 0.6216 and resistances at 0.7036 and 0.7725. Traders should watch for breaks of these critical levels to open positions. The fixed range volume profile indicates significant trading activity between 0.7036 and 0.6495, making trading within this range challenging. Long positions should be considered above 0.7036, while short positions should be considered below 0.6216. Always keep an eye on Bitcoin's market conditions as it significantly influences KAVA's price action.
🧠💼It's important to acknowledge the inherent risks in futures trading, with the potential for margin calls if risk management is neglected. Always adhere to strict capital management principles and utilize stop-loss orders, ensuring that the initial target offers a risk-to-reward ratio of 2.
🫶If you enjoyed this analysis and want to support me, please boost this analysis. Feel free to leave a comment or suggest a coin you'd like me to analyze next.

KAVAUSDT Triangle Pattern!KAVAUSDT Technical analysis update
KAVA has formed a triangle pattern on the 4-hour chart. It is currently bouncing from the triangle support, indicating that we can expect a significant move from the current support level.
Regards
Hexa

KAVA looks bullishKAVA appears to be forming a bullish triangle.
We now seem to be in the final wave of the triangle (Wave E).
By maintaining the green range, it can move towards the targets
The targets are clear on the chart.
Closing a daily candle below the invalidation level will violate the analysis.
For risk management, please don't forget stop loss and capital management
When we reach the first target, save some profit and then change the stop to entry
Comment if you have any questions
Thank You

KAVAUSD 1WKAVA ~ 1W
#KAVA This is a very good support block to start accumulating again.
Make purchases gradually from here, with a minimum target of 20%+

KAVA/USDT is Getting Ready for a Potential Breakout 👀🚀💎Paradisers, get ready for a potential breakout with #KAVAUSDT, as it navigates the confines of a Falling Wedge. Bolstered by the 50-day EMA aligning with this pattern, the price is ripe for a bullish surge. Holding steady at the support of $0.632, there's an excellent chance for #KAVA to pierce through the Falling Wedge.
💎If SEED_DONKEYDAN_MARKET_CAP:KAVA falters, losing steam at the $0.632 mark and tumbling below, we might be staring down a protracted downtrend. The next pivotal demand zone awaits at $0.606—a region renowned for its ability to trigger robust bullish rebounds, thanks to its heavy liquidity.
💎If #KAVA revisits this critical area, securing a firm rebound is imperative to sustain support. Should it fail to muster a bounce back, we could see an increase in bearish pressure, deteriorating market sentiment, and potentially deeper price declines.
💎Keep your strategies flexible and your senses honed, Paradisers. Your ParadiseTeam is diligently observing and ready to navigate you through the dynamic shifts of the #Kava market.
MyCryptoParadise
iFeel the success

✨ KAVAUSDT: Bullish Breakout Anticipated After Consolidation📊 Chart Analysis :
The KAVAUSDT 1D chart indicates a potential bullish breakout following a period of consolidation. The downtrend line drawn from early April has been tested multiple times, with the price now approaching a breakout point. The key aspects of this chart include:
- Resistance Level: The downward trendline around $0.68, acting as a significant resistance.
- Potential Target: Based on the breakout projection, the target price is around $0.83, indicating a potential upside of approximately 25%.
- Volume: A spike in volume upon breaking the trendline will confirm the breakout and strengthen the bullish case.
🔍 Technical Indicator Analysis :
Analyzing the technical indicators across different timeframes reveals mixed signals but a generally bullish outlook in the short to mid-term.
Momentum:
- RSI: Neutral across all timeframes, indicating neither overbought nor oversold conditions, with a slight bullish bias in the short term (1h at 58.1).
Trend:
- ADX: Mostly neutral, indicating a lack of strong trend strength currently.
- CCI: Bullish in the short term (1h at 195.9), but turns neutral or slightly bearish in longer timeframes.
- Ichimoku: Bullish in the short to mid-term (up to 12h), indicating a positive trend development. However, it turns bearish in the longer term (3d, 1w).
- MACD: Bullish in the short term but turns bearish in the mid to long term (6h to 1w).
Volatility:
- ATR: Low fluctuation across most timeframes, indicating low volatility and potential for a breakout.
- Bollinger Bands: Neutral in the short term but high fluctuation in the longer term, suggesting increasing volatility.
Volume:
- ADI, OBV, VWAP: ADI and OBV show bearish signals in the short term but turn bullish in the longer term, indicating accumulation. VWAP remains bullish across most timeframes.
🔮 Prediction :
Short-term (1h - 4h): Expect a bullish movement as indicated by the bullish MACD and CCI.
Mid-term (6h - 12h): Continued bullish momentum is likely, supported by bullish Ichimoku and ADI indicators.
Long-term (3d - 1w): Caution is advised as longer-term indicators suggest potential bearish trends and high fluctuation volatility.
📝 Conclusion :
KAVAUSDT is positioned for a potential bullish breakout following a period of consolidation. Short to mid-term indicators favor upward movement, while longer-term signals urge caution due to potential bearish trends and increased volatility.
💡 Final Call :
- Watch for a breakout above $0.68 ~ $0.69 with increased volume for confirmation.
- Monitor key support at $0.58 and resistance at $0.65.
- Prepare for potential volatility and manage risk appropriately.
- Remember, Patience is the key in trading.
🙏 Thank You :
Thank you for reading this analysis. Always conduct your own research (DYOR) and make informed trading decisions. Happy trading!
#TechnicalAnalysis #KAVAUSDT #CryptoTrading #BullishBreakout #Cryptocurrency

Keep an eye on the #KAVA/USDT Keep an eye on the #KAVA/USDT Diagonal Trendline retest and PWL $0.6075 support level in 4-Hour TF!
For TP, we can target the upper 4-hour FVG.
#KAVA/USDT#KAVA
The price is moving in a 1-hour bearish channel and sticking to it well
The price rebounded well from the lower border of its neck at the green support level of 0.660
We have a tendency to stabilize above the Moving Average 100
We have oversold RSI to support the upside
Entry price is 0670
The first target is 0.7180
The second target is 0.7435
The third goal is 0.7723

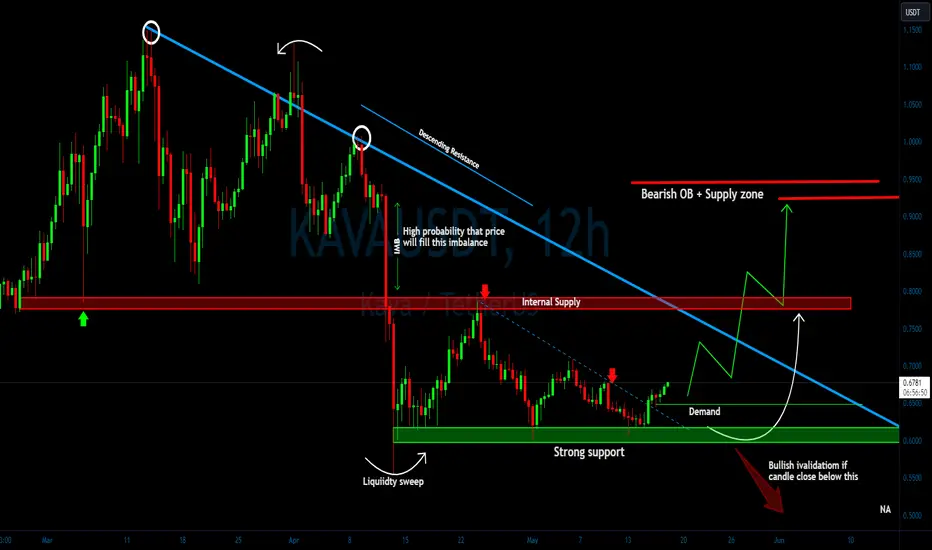
KAVA/USDT upward trajectory from demand? 👀🚀KAVA analysis💎 Paradisers, take note as #KAVAUSDT is currently making a noteworthy move, trading within a demand zone that significantly raises the likelihood of a bullish trend.
💎 Previously, we've observed #KAVA consistently respecting descending resistance. Currently, as the price regains momentum at the demand level of $0.6489, there's a high chance that it could overcome the descending resistance and tackle the noted Bearish Order Block.
💎 However, considering the inherent volatility of the market, if SEED_DONKEYDAN_MARKET_CAP:KAVA fails to maintain its momentum and falls below the demand level at $0.6489, this could indicate a softening of the bullish stance, potentially leading to a substantial price drop.
💎Should this occur, we will shift to plan B: we may witness a bullish rebound from the lower, substantial support level at $0.5963, although breaking below this level could trigger significant downward movements.
MyCryptoParadise
iFeel the success🌴
"KAVA" Extended wave next...Hello, friends. Nice to meet you
After breaking the RISING WEDGE down,
It shows a very strong extended wave.
If the upper line of this extended wave is broken upward, it is likely to rise to the recent high.

$KAVA may skip the 2024 Bull RunBINANCE:KAVAUSDT , 1d
After reaching failing to break it’s 2024 high around the $1.15 area, price created a lower high and broke below the 200SMA forming a lower low. This creates a bearish sentiment for KAVA.
The downward trendline aligns with the stiff resistance created by 200SMA and previous support turned resistance. This is a key level where bears will look for shorting opportunities. Keep an eye on the charts and wait for price reaction to initiate a trade.
The only indicator making a bullish case for KAVA is the bullish MACD crossover but price has to ultimately breakout of the downward trendline and 200SMA and remain above it to bring back the bullish sentiment.
As always, “anything can happen” so let the market unfold and react accordingly. #DYOR

Technical Analysis Reveals Explosive Gain PotentialWatch out, crypto-enthusiasts! Our latest technical analysis reveals that KAVA could be on the verge of a meteoric rise. The study of the graph demonstrates a remarkable compression zone, often precursor to increased volatility and imminent directional movement.
The recent consolidation in the support area, combined with a decline in volumes, suggests a discreet accumulation by informed actors. Such a price squeeze is a classic prelude to a powerful boost. The key indicator here is the underlying resistance. A breakthrough beyond this border could catalyze an impressive rally, with a target projection indicating a potential increase of 145.74%, as denoted by the sky blue rectangle.
This setup is not only a signal for traders, but a call to anyone looking to capitalize on the dynamic opportunities offered by cryptos like KAVA. For sophisticated technical analysis, insightful forecasts and real-time trading advice, be sure to follow me. Together, let’s discover the gems of the crypto market

Last post didnt have full screenshotIdk why that happened, just take a look at the previous post, should be linked to this

Last trendline remains, lets share our thoughts :)You can probably see the image
200ema broke,
Some trendlines broke (pink for closer and blue for longer trendlines)
Now so far i am expecting a rebounce (not immediately) from lowest trendline
Unless ofc iran/israel stuff worsens, we may go even low
Anyway, let me know if anything can be improved in the chart

KAVA🔔When will she wake up?🔔Looks like everything is ready for growth. We are waiting for a miracle. I'm already tired of holding futures)
