KAVAUSDT Long-Term Accumulation/Distribution StrategyKAVAUSDT is presenting a compelling opportunity for long-term accumulation and distribution. With an entry price range between $0.65 to $0.4 and a target price of $5, this strategy aims for substantial returns over time.
Weekly charts reveal a significant increase in volume over time, indicating strong accumulation. This accumulation phase suggests underlying strength in the asset, making it an attractive opportunity for investors seeking long-term growth.
Risk Management:
To mitigate risk, consider allocating 1-5% of your portfolio at higher price levels, increasing to 5-10% and 10-20% as prices decline. By diversifying your investments and managing risk levels accordingly, you can navigate market fluctuations effectively.
Note: split your major money like if you have 1000$, split it into 10 parts so each trade has 100$ allocation, now use that 100$ to buy in 1-5%, 5-10% & 10-20% respectively.
With a strategic long-term approach and diligent risk management, KAVAUSDT offers the potential for substantial returns. Remember to think long-term to build sustainable wealth and capitalize on the opportunities presented by this asset.
KAVAUST trade ideas

KAVAUSDTAccording to the relevant news and supply and demand levels, you have a good potential to reach the relevant levels


KAVA Impulse Wave
We have a reversal pattern in place.
Black wave 2 happened as a flat correction (blue ABC), and black 3 should find resistance soon, probably in the gray ascending trendline which dates from 2023.
Pullbacks for black 4 are buying opportunities.

KAVAUSDT Falling WedgeKAVAUSDT technical analysis update
KAVAUSDT has formed a falling wedge pattern and has been trading within this pattern for 1,450 days. The price has now touched both the falling wedge support and the March 2020 bottom support, which is considered a strong support level for KAVA. We can expect a significant bounce from the current level.
Regards
Hexa


KAVAUSDT Reversal Confirmed!KAVUSDT Technical ANlsysis update
SEED_DONKEYDAN_MARKET_CAP:KAVA price has formed a triangle pattern on the daily chart at the bottom. The price has now broken the triangle resistance line and is trading above the 100 EMA on the daily chart. We can expect a strong bullish move from the current level. A sustained move above this level could signal further upside potential.
In the weekly chart, KAVA price is bouncing from the 2020 support level and trading within a falling wedge pattern

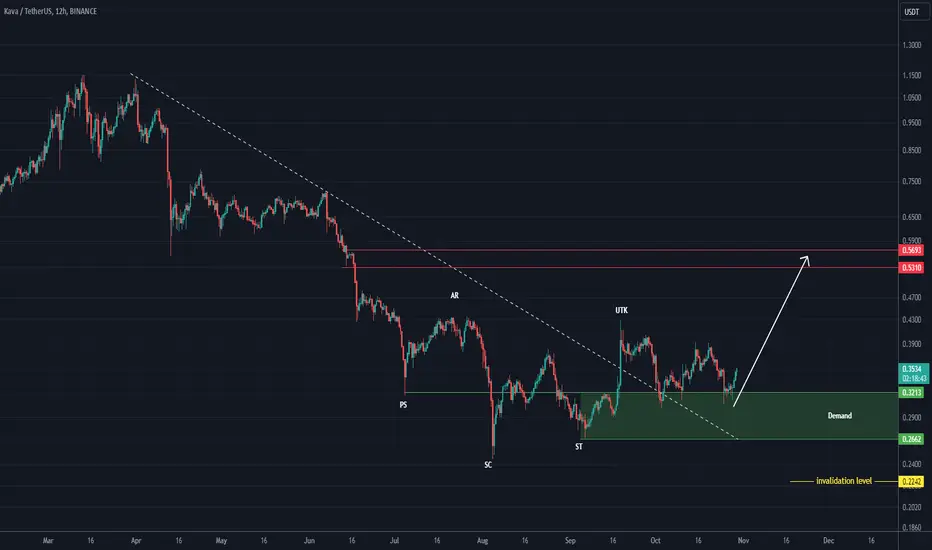
KAVA is really bullishWe have signs of a trend reversal at the bottom for KAVA.
Many buy orders have been collected. In our opinion, the upcoming resistances will be broken and the price will reach the red box.
The target is a red box.
Closing a daily candle below the invalidation level will violate this analysis.
For risk management, please don't forget stop loss and capital management
Comment if you have any questions
Thank You
Trading Signal for KAVAUSDT: Sell OpportunityAttention traders! We have identified a potential trading opportunity for the KAVAUSDT currency pair using our EASY Quantum Ai strategy.
Direction: Sell
Enter Price: 0.4083
Take Profit: 0.37546667
Stop Loss: 0.44836667
Justification for the Forecast:
The current analysis, facilitated by our EASY Quantum Ai strategy, points towards a downward movement for KAVAUSDT. Several factors contribute to this prediction:
1. Technical Indicators: Our strategy employs a combination of moving averages and momentum indicators, which suggest a bearish trend is forming. The divergence observed in the momentum indicators indicates a potential sell-off.
2. Market Sentiment: Based on social media trends and news analysis, there is an increase in negative sentiment towards the KAVA token, possibly leading to reduced demand.
3. Volume Analysis: A decrease in trading volumes signals waning buying interest, which may strengthen the sell direction predicted.
This signal is designed to help you capitalize on anticipated market movements. Ensure you conduct further analysis and consider your risk management strategy before entering the trade.
Trade safely and profitably!

Buy Trade KAVA: Capitalizing on Cross-Chain DeFi Lending
Description:
This trading idea is centered on KAVA, a decentralized finance (DeFi) platform that offers a suite of financial services, including lending and stablecoins, while enabling cross-chain interoperability. Built on the Cosmos blockchain, KAVA allows users to borrow and lend assets across multiple blockchains, enhancing liquidity and expanding its DeFi use cases. The KAVA protocol’s focus on providing seamless cross-chain solutions and its unique position within the DeFi landscape make it a promising asset for investors seeking exposure to this rapidly growing sector.
As KAVA continues to innovate and integrate more assets into its cross-chain ecosystem, its adoption potential and fundamental value increase. However, like all cryptocurrencies, KAVA is subject to market volatility, regulatory changes, and fluctuations in market sentiment, which can lead to rapid price swings and associated risks for investors.
Disclaimer:
This trading idea is intended solely for educational purposes and does not constitute financial advice. Investing in cryptocurrencies, including KAVA, carries significant risk, including the potential for complete capital loss. Always perform thorough research, assess your financial circumstances, and consult a financial advisor before making any investment decisions. Past performance is not indicative of future results.

KAVAUSDTKAVA ~ 1W
#KAVA Back to retesting this support block,. If you still have Conviction on this coin,. This support block would be a good buying spot for now.

KAVAUSDT: Bullish Trend (Harmonic Pattern)KAVAUSDT is moving in uptrend and currently its formed perfect Harmonic Pattern with bullish divergence on 30mint time frame, so we will wait for the break of the previous resistant level for the confirmation of the bullish trend and take a long trade.

KAVAUSDT_LONG IDEAKAVAUSDT was in a bearish trend but now it has failed to make another lower low the formation of higher low and higher high shows strenght in its structure along with that it has came so far from the weekly trendline so it will go upside to retest that area seems a very good setup. do your own research before taking the trade.
IT IS A SWING SETUP SO HAVE PATIENCE.

Is #KAVA on the Brink of a Massive Breakout? Don’t Miss ThisYello, Paradisers! Is this the moment we’ve been waiting for the #KAVAUSDT? Let's look at the latest analysis of the #KAVA and see what's happening:
💎#Kava is currently compressed within a falling wedge pattern, building up momentum for a potential bullish breakout.
💎If the bulls muster enough strength, we could see KAVAUSDT break free from this formation, potentially igniting a powerful bullish wave. The price may surge toward the internal resistance zone around $0.388 if this trend continues. We might even see momentum push toward a major resistance level if momentum persists!
💎But caution is essential. If the bulls can’t deliver the necessary momentum, we might see KAVA slipping toward the lower support zone at $0.23–$0.25 as it hunts for liquidity.
💎If this critical support zone also fails, bearish pressure could increase, leading to a further decline.
Stay focused, patient, and disciplined, Paradisers🥂
MyCryptoParadise
iFeel the success🌴

KAVA — Getting Ready For An Entry!Kava (KAVA) has shown significant strength with a recent massive breakout, accompanied by heavy volume—always a promising sign.
Before this move, KAVA had formed a solid double-bottom pattern, a classic reversal indicator suggesting that selling pressure has been exhausted.
What I Am Watching
$0.43 Resistance: The latest pump was rejected at this level, making it a crucial resistance zone. The upside potential becomes much more apparent if KAVA can close above and confirm this level.
My Trade Setup
Entry: I’m waiting for a close above $0.43 with confirmation to enter a position. Once this level is cleared, the path for a potential bullish run opens up.
First Target: My crucial target is $0.65, offering a potential upside of almost 50% from the breakout. Given the volume and momentum, this target seems achievable once the $0.43 level is breached and confirmed.
Key Takeaway
KAVA’s recent breakout is compelling, but patience is key. The $0.43 level needs to be cleared for a solid entry. After confirmation, this trade offers a healthy 50% potential gain, with $0.65 being the primary target.
This is definitely one to keep on the radar!

Kava | Repeat Of 2020 Dynamics (800%+ Potential For Growth)Let me start by saying that the long-term target can end up being much higher than 800%...
Here we are looking at Kava vs Tether (KAVAUSDT) and we have the same dynamics as we saw back in 2020 before a major bull-market.
A consolidation channel breaks down producing a strong bottom. This bottom signals the start of a major bullish-phase. In 2020/21, KAVAUSDT grew 3,736% in a total of 539 days.
We have a long-term higher low based on candle wick.
We have a long-term lower low based on candle close.
We have a long-term double-bottom in general.
The market is better now, Crypto that is.
The market is stronger now, growing and evolving.
The market continues to mature.
Fiat is worth much less now compared to 4-5 years ago...
We have potential to hit a new All-Time High in 2025, it wouldn't be surprising at all.
Expect maximum growth.
You are likely looking at the bottom for this Altcoin trading pair, KAVAUSDT.
Once we hit bottom, there is no other place left to go but up... And up we go!
Namaste.

KAVAUSDTKAVA ~ 1W ✅
#KAVA This is the final support for this Coin. if you have Conviction on this coin,. This should be a very good price for you to make a purchase. at least for 20%++


KAVA Technical Analysis in a Weekly TimeframeHello everyone, I’m Cryptorphic.
I’ve been sharing insightful charts and analysis for the past seven years.
Follow me for:
~ Unbiased analyses on trending altcoins.
~ Identifying altcoins with 10x-50x potential.
~ Futures trade setups.
~ Daily updates on Bitcoin and Ethereum.
~ High time frame (HTF) market bottom and top calls.
~ Short-term market movements.
~ Charts supported by critical fundamentals.
Now, let’s dive into this chart analysis:
Since August 2021, KAVA has been in a downtrend and is now close to an all-time low. There has been no significant growth, and the current price range seems to be a dead end.
If KAVA doesn't manage to recover, we could see a new all-time low and a price discovery phase toward the downside.
In my opinion, KAVA should respect this ATL support, rebound by breaking above the resistance trendline, and start a bullish rally. The RSI is in the oversold zone, indicating a potential bullish move.
Key levels:
- Important Support/Accumulation: $0.2403
- Primary Resistance: $0.558
- Long-term Target: 10x-20x
DYOR, NFA
Please hit the like button to support my content and share your thoughts in the comment section. Feel free to request any chart analysis you’d like to see!
Thank you!
#PEACE

Kava long road to 6$BINANCE:KAVAUSDT
Kava personally for me underrated now. 100% coins in circulation supply only 1b
Possible Targets and explanation idea
➡️Weekly tf, trade around 27 accumulation block
➡️Jan 2023 got main signal to buy on W based on Trade on indicator
➡️Trade around buy line on take profit indicator
➡️Road to 6B market cap and sweep EqHigh Jan-Apr 2022
➡️Money inflow on Weekly tf on money power indicator and MACD div like confirmation
➡️ Main targets for bull run I think way higher 6b market cap
Hope you enjoyed the content I created, You can support with your likes and comments this idea so more people can watch!
✅Disclaimer: Please be aware of the risks involved in trading. This idea was made for educational purposes only not for financial Investment Purposes.
---
• Look at my ideas about interesting altcoins in the related section down below ↓
• For more ideas please hit "Like" and "Follow"!

KAVA (Kava.io): Approaching ResistanceTrade setup : Price remains in a downtrend, trading well below 200-day moving average. It had a bearish breakout from Falling Wedge pattern and dipped as low as $0.32, making a new 52-week low. It bounced from very oversold levels (RSI < 25!) near that $0.32 support and is approaching $0.42 resistance now, where it's likely to get rejected and revisit $0.32. It's too early to tell if this is a sign of trend reversal or just a bounce in a downtrend.
Pattern : Price is Approaching Resistance , which is a level where it could pause or reverse its recent advance, at least temporarily. Resistance is often a level where price got rejected in the past, or potentially prior Support level that was broken. (concept known as polarity). Once price breaks above resistance, it can advance higher to the next resistance level. Learn to trade key levels in Lesson 7.
Trend : Short-term trend is Strong Down, Medium-term trend is Strong Down and Long-term trend is Strong Down.
Momentum : Price is neither overbought nor oversold currently, based on RSI-14 levels (RSI > 30 and RSI < 70).
Support and Resistance : Nearest Support Zone is $0.32. Nearest Resistance Zone is $0.42, then $0.55.

Kava to BuyKava have broken out of its downwards trend. a potential buy call can be taken at around 0.4000. for target price of 0.4200 and stoploss would be 0.3950

Wyckoff Spring on the works...Morning fellas,
Market really pushing some buttons lately.
Two things:
1) I hope you have not sold at a loss.
2) I hope you have had money to buy these drops as I believe it's still time to accumulate long term.
With that being said, I think we could still drop and maybe stop hunt the lows 25 cents.
I'll be adding more there.
Trade thirsty, my friends.
