KCSBTC Buy !!!Sweet Shopping zone 0.0001872-0.0001621
Purchase level 0.0001762
You can buy all three levels with a ladder !!!
A small lesson on the price of volume, zone and level of control !!!
The price of the total volume is 0.0001354
Suppose:
At this price, the average purchase of the exchange itself turned out!
The volume price of 0.0004388 is the average selling price.
The difference is the profit of the exchange itself on its own token !!!
What happens at the levels in the zones?
In the control zone, the mirror level of 0.0002246 worked out !!!
Thank you all!
Have a good trade!
KCSBTC trade ideas

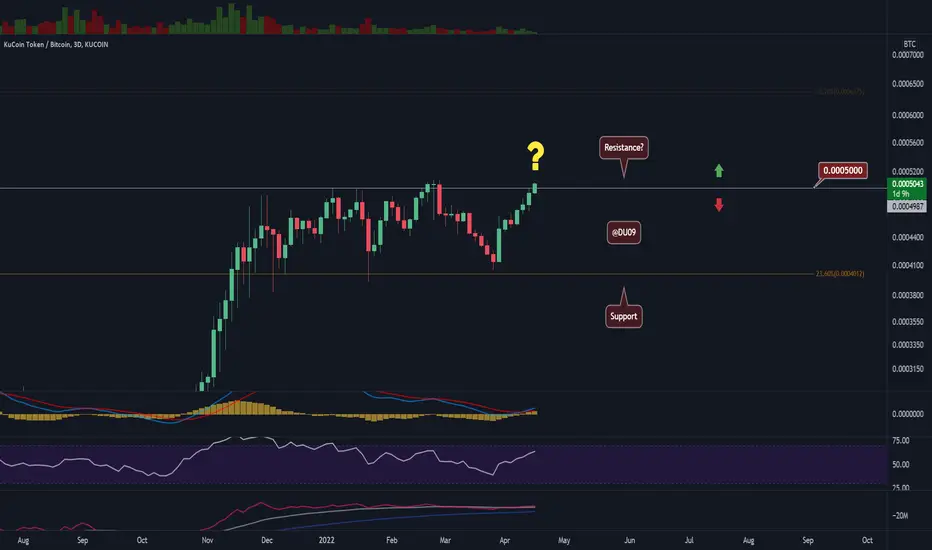
BUY $KCS pair on BitcoinBuying Rules passed
1. Support created
2. MFI oversold
3. Stochastic RSI curling up out of oversold
4. Top/bottom finder finds Bottom prints light green.
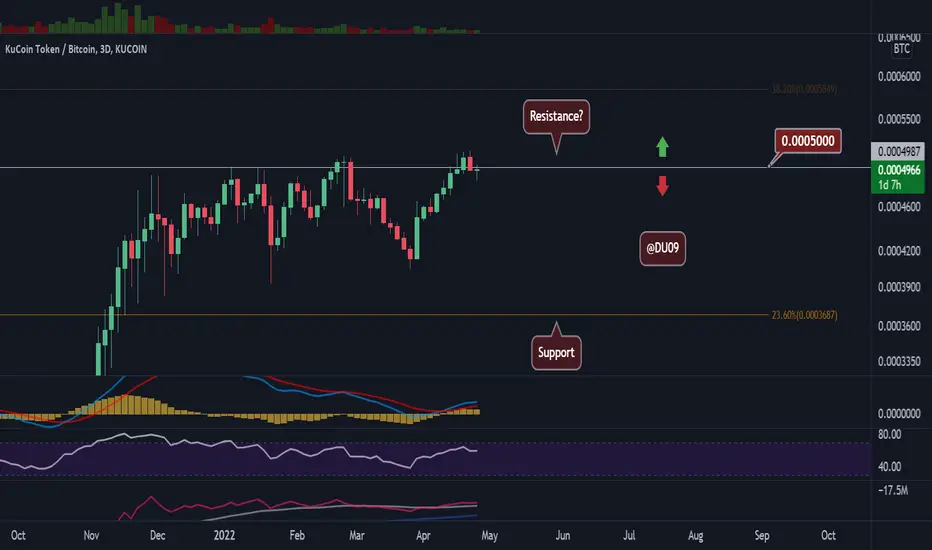
look for resistance at 4897 - 5100, if this breaks we go to 5890

KCS/BTC - The KCS magic vs Bitcoin may be fading! 😢KuCoin managed to outperform Bitcoin for the first six months of 2022. However, things appear to have changed in the past two months with KCS failing to make higher highs vs Bitcoin.
Now, the price is found at critical support at 5k satoshi and if it fails to hold here then KCS could fall back to 4k-3k satoshi.
The indicators are bearish and the USD chart is not looking better either. See below.
At best, KCS could consolidate above 3k satoshi and hopefully the market together with BTC will find a bottom that will allow KCS to recover again.
The bias remains bearish on this price action and I will revert back to this chart once we have a clean break from this current level.
Like and follow if you liked my idea!

KCS/BTC - Surprisingly, KuCoin is flat vs BTC! 💪KuCoin's price has been surprisingly flat versus Bitcoin during this massive crash. More so, overall it outperformed Bitcoin during the bear market, this is quite surprising and a sign of strength.
Right now, the price is found in a flat trend vs Bitcoin without any significant change.
Price is stuck between the 5k satoshi support and 5.8k resistance.
A break from this range is needed for KCS to pick a direction. But a flat trend in a bear market is more than enough to keep holders satisfied.
The situation vs USD is slightly different, see below.
As such, keep a close eye on KCS's price vs USD. If it falls under $10, things may get spicy.
Bias on this chart is neutral.
Like and follow if you like my idea!

KCS/BTC - Resistance hit, time for some cooldown. 🤔KCS on the Bitcoin pair has hit the key resistance at 5.8k satoshi.
Now, the price is reversing and if we are to look at the USD pair (see idea below) it seems the bullish momentum may have to take a pause.
For this reason, a retest of the 5k satoshi support line may be in order before KCS can hope to break the key resistance here.
The indicators on the daily timeframe are also curving back down and may signal a local top.
Bias is short on this price action, best to be on guard here and keep a close eye on the support.
Like and follow if you like my idea!

KCS/BTC - Major BREAKOUT above 5k Satoshi!!! 💪KuCoin Token has broken above 5k satoshi and exploded much higher on sustained volume!
This is a major breakout with a price not seen since 2018 vs BTC!
If momentum keeps up, KCS could challenge the all time high sitting at 15k Satoshi.
The first key resistance is found at 5.8k satoshi and then at 7.6k.
The support at 5k statoshi was not really tested, so probably price will revisit this area in case of a pullback.
Overall, a great performance from KCS and likely to continue.
Bias remains bullish on this price action and the indicators also support further uptrend.
Like and follow if you liked my idea!

KCS/BTC - A FULL reversal in a few days! 🤩KCS continues to impress with almost a full reversal from the previous lows which were tested during the 12 May crash.
Support held steady and on the BTC pair, KCS remains strong and may outperform Bitcoin if it manages to escape this large channel with a key resistance at 5k satoshi.
If successful, KCS could run and make some sustained gains against Bitcoin.
For now, KCS is making a nice recovery and indicators are slowly turning bullish. If next week KCS manages to maintain this momentum, then a test of the key resistance becomes likely.
Bias is bullish in the short term, or at least until price reaches the key resistance, then we have to reassess.
Also see below the KCS/USD pair analysis which is also bullish.
Like and follow if you liked this idea!

KCS/BTC - KuCoin holding well against Bitcoin!On the KCS/BTC chart, KuCoin is holding pretty well. For the USD pair see below my idea.
This is good since KCS is not underperforming BTC.
This range just under 5k statoshi is looking interesting as price made a higher high.
Can KCS outperform BTC? Unlikely, but not impossible.
The indicators are flat and this consolidation may continue for a while, but I'd not be surprised to see KCS breaking above 5k satoshi soon.
Bias is neutral on this chart.
Like and follow if you liked my idea!

KCS/BTC - KuCoin at a CRITICAL level! 😲The key resistance at 5k satoshi seems to hold so far, but KCS could break it again.
Bulls really have to turn this level in support to sustain a possible rally that would outpace and outperform BTC.
For now, the KCS/USD pair (see below) is bearish, but KCS has managed to make a higher high versus Bitcoin not seen since 2018! This is significant.
The MACD is also bullish, but momentum is a bit weak for buyers right now. Best to be patient here and wait for a clear signal.
I am neutral on this price action and we need more time to get a sense of the next direction vs BTC.
Like and follow if you liked my idea!
KCS/BTC - Major Breakout vs BTC not seen since 2018! 🚀KCS is about to break above a key resistance vs BTC and set a new high not seen since 2018! 😲
If successful, KCS may enter a rally against BTC... which would be impressive.
On the USD chart (see below my idea), KCS also appears ready to rally, but it is too early to call it on that side. However, on this BTC chart, KCS looks strong.
Monday can be decisive. If KCS breaks away and pumps, it's done.
Expect some exciting price action!
Bias is bullish on this chart and so are the indicators, including volume!
Like and follow if you liked my idea!
KCS/BTC - KuCoin Holds Well Versus Bitcoin! Is it enough?🧐While on the USD pair KCS is fighting to stay above $19 (see the related idea below), on the BTC pair, KuCoin Token is doing much better and has maintained its value against BTC.
So far price has managed to stay within a nice range with resistance at 5k statoshi. A break above this key level would see KCS outperform Bitcoin which would be quite impressive.
It is too early to tell, but for now KCS is holding well at these price levels. Nevertheless, holding versus Bitcoin will not be enough if prices against the USD continue to fall.
Usually altcoins perform worse than Bitcoin, but in this case, KCS is an outlier and this is a show of strength.
Bias on this chart is neutral. I recommend you also read my KCS/USD analysis for a complete picture.
Like and follow if you liked this idea!
KuCoin Token vs Bitcoin | Facing Strong ResistanceNow we go for KCSBTC (KuCoin Token vs Bitcoin) and this one has also being doing really since January 2021.
Now, we can start by saying that the USDT and BTC charts are similar.
We do not have the same chart/structure/pattern, but we have the same cycle.
A low was set for KuCoin Token (KCS) in December 2020 both vs Bitcoin (BTC) and Tether (USDT), then we have over a year of growth with little correction.
Looking from an EW perspective we can have a truncated 5 here... Meaning that the 5 wave impulse is over and a corrective wave should form, but that's predicting of course, let's just focus on the chart.
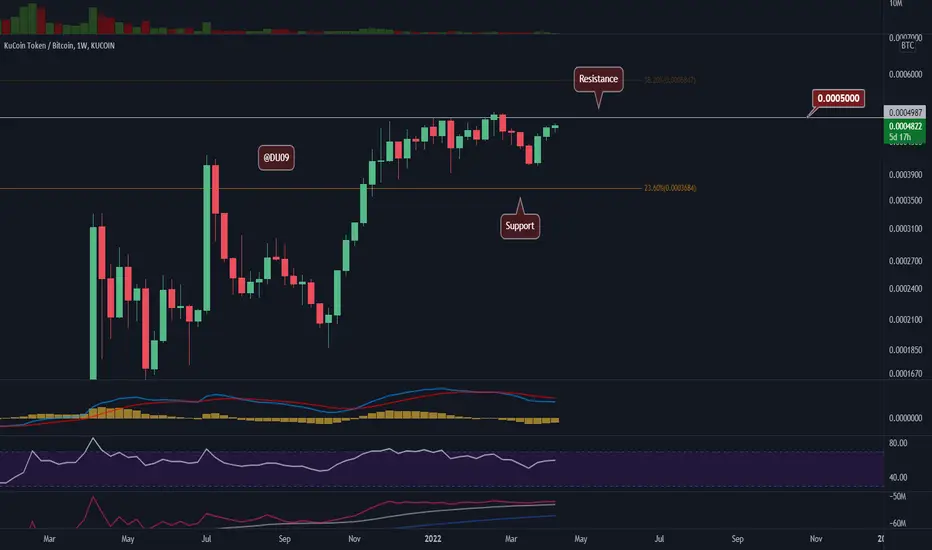
The "very strong resistance" is where we are at now and the signals are not favoring the bulls.
We have this bearish candle as bullish momentum wanes:
We have a very strong bearish cross on the MACD and the histogram has gone red:
The MACD is also at its all-time high, plenty of room available to retrace.
Conclusion
KCSBTC is likely to continue to grow long-term but a correction has high probability in the weeks ahead.
This is not trading advice.
You need your own plan/strategy to trade.
For example, we never trade such a chart (near resistance/high prices), we look for different ones.
I hope you enjoyed this analysis.
Thanks a lot for your support.
Namaste.

Long KCSBTCLong KCSBTC
I will entered this trade after break out and retest of the monthly open 4770 sats. We are breaking out of the range that began in mid november.
Entry trigger 4H above 4770
1st target 5097 sat zone
2nd target 5558 sat zone
Invalidation daily close below 4100 sats

kcs/btc long term investits long term investment and also a huge R/R !
just be careful about bearish divergence / hidden bearish divergence and nothing confirmed about it yet
not financial advice !


KCSBTC Technical Analysis⏳ Spot
💎 KCSBTC has been moving along the ascending channel and has been making HHs and HLs. It has broken above the channel, I expect a retest before it continues higher.
🌐 Tradingview
🏁 Short & Medium Term
💵 Invest Only 5% of your Portfolio
🎳 Entry at Market or at 0.0002335 - 0.0002275
☕️ TP1 0.0002666
🍺 TP2 0.0002920
🍻 TP3 0.0003365
🍾 TP4 0.0004000
🍷 TP5
🍸 TP6
🍹 TP7
🎁 TP8
🚫 SL 0.0002150
Good Luck 🎲
Check the Links in Description and If you LIKE this analysis, Please support our page and Ideas by hitting the LIKE 👍 button. ❤️ Your Support is really appreciated! ❤️
Traders, if you have your own opinion about it, please write your own in the comment box. We will be glad for this.
Feel free to request any pair/instrument analysis or ask any questions in the comment section below.
We will have more FREE forecasts in TradingView soon
Have a profitable day 😊👍🏻

KCS/BTC BreakoutKCS against the BTC pairing is currently in breakout. We are looking for a solid push up. BTC has support not too far away so it looks like the USDT value can increase as well. Signal posted in channel. Make sure to view it and follow for more upcoming breakout trades. Like, Follow, Comment.

KCS/BTC as of 2021-08-28KCS is currently respecting an ascending trendline which does not look like breaking anytime soon. My buy orders are at these 3 key support levels:
A) 0.0002501
B) 0.0001751
C) 0.0001476


KCS/BTC breakoutI see KCS breaking out from a falling wedge against BTC in KCS/BTC pair.
A conservative exit would be 50% gain considering the wedge height along, while a long term exit would be 100% gain considering the pole height too.


KCS will reach new high ~ 75k stsKCS has KCC chain, KCS price has new power to up!
KCS will reach 47.5k sts => 75k sts and has chance to reach 130k sts at the end of bullrun.
130k sts is high, but 75k sts is entry price for KCS.
