KDA/USDT Here we have a beautiful cup pattern☕😍. Buy after breaking resistance or in supports
Like and comment please ❤
KDAUSDT.P trade ideas

KDA 3rd WaveI painstackingly charted the elliot wave chart for KDA and found that we just finished our second wave(potentially, although to support this we've hit the .618 taking a fib from the bottom of the first motive wave to the top, as well as the stoch rsi and MFI almost over sold on the 3D). This means we're entering the third motive wave which is almost always the most bullish wave in an elliot wave chart. This with Kaddex coming out within the next two quarters, start stacking!!!
Sorry to add on we also broke out of the bullish flag we've been in since ATH.Looking at the VPVR we're also at a pretty strong support around 11 bucks.

#KDA $5 or $40 ?#KDA is in downtrend and try to break out the triangle and dynamic resistance at the area of 11-12. #KADENA needs to break out the strong resistance at the area of 14 to change to trend
Next important support and key levels of #KDA are 8 and 5.5
Of market drop and start correcting, you should pay attention to those two important supporting levels as entry points
Good luck

KDA's next move!KDA recently had a major pullback after a great run. In my analysis, the pink lines are the demand zones. As you can see, the fib levels are being respected, specifically the golden pocket - 0.618. If KDA can have a daily close over the 0.618, I believe we could see another leg up. If the green trend line breaks to the downside, we could potentially see this go back down to around $6.60. I am long on KDA as I believe in this project. Always DYOR.

KDAUSDT - head and shoulders, potential long term break outClose above pivot point, confirms break of neckline and will be the momentum need to run til $15
close below... back down to $9 res.

KDA.Usdt (Y21.P7.E1).BTC fractalHi All,
It seems there is a similar pattern to BTC bullrun for 2017 top or ATH.
I do still believe we are in accumulation mode for BTC so this ALT will therefore likely play out with a rejection at the 0.618 or 0.786 level for an inverted barr structure.
KADENA has a fantastic start and I missed the bottom entry...those who got the bottom could be very successful if they never get rid of them.
Finding the next entry is difficult but lets give it a go.
All the best,
S.SAri
FYI.
If this is a reaccumulation or distribution structure...we have one of many scenarios.

A powerful technology KDAA powerful technology
With an exquisite chart
And with much more beautiful targets
Everything is ready to go to the top 10 cryptocurrencies
Let's go
buy at $10 and $6
good luck


KDA 5 wave theory I believe that we finished our first motive wave early November, with the 5 waves up(the 5th wave seemed to be the extension wave instead of the third, which explains the dramatic retracement from ath). I believe we are currently in the 2nd correction wave down which I believe should take us somewhere around the 0.786 for the third leg down -- correlates to a major support KDA has although it doesn't have much support since it went pretty quickly up.
Assuming that'd be the end of the retracement, we would start our third wave up -- I charted the c wave as the extension wave with the ending being at the 3.618, def could be much shorter though.
In any case this is just a general theory that I'll be updating as time passes. I'm long term bullish on this project, fantastic team behind it and great fundamentals.


KADENAIn the video, I explain my current view on $KDA, examining price from a top down perspective from the weekly to hourly timeframe looking at volume, price, and chart patterns; inclusive of BTCs impact on current price.

KDA/USDT LONG Entry 12.9593
SL 8.2075
TP1 28.3048
TP2 38.7822
TP3 58.1239
TP4 128.2300
maybe something to look at

Kadena 2nd Wave Play1st wave cycle completed. Looks like for 2nd wave, we have A in a smaller degree in, now we need to see a rise in B (looks like a FLAT) and then we will find a lower low for C.
Thereafter, we take off for an epic Wave 3 run.
Blue carrot icons mark fib levels for a Wave 2.

KDA
Hi, Wellcome
We can open a Nice order here, You just need to open the Trade At the Retest not just after the Breakout.
Because confirmation is necessary rather than losing money.
So just follow the mentioned
Open Order Price
TP Price
SL price
Note: please keep in mind that if any bad news happens regarding this Coin then you should need to work promptly.

KDAUSDT Daily TimeframeReversal with confirmation? when dynamic support working good as last barrier
#tayor

KDAUSDT 8hI'll enter to KDA when it breaks the resistance(middle line of descending channel + 0.786 Fib level). Target would be $13.50


KDAUSDT Consolidation Nears Its FinishKDA has been an absolute cash cow for me. I got in around 2.00 and have been taking profit ever since. It is a great project and I estimate that it will likely near its previous highs by the end of the cycle. During this pullback the patterns have flip flopped between a flag and a pennant but seemed to keep the overall shape of an asset likely to continue its run. For that, I am very grateful. Based on the RSI I would say this consolidation is nearing its end. It may have a little bit more to go, but I highly doubt it will far much further. Great time to enter. Thanks everyone!
This is not financial advice. Do your own due diligence.

BOTTOM IS IN FOR KDAEveryone knows how strong this project is. While I think we do possibly range around here for a while (depending on BTC), I think the bottom is in and this range is all for consolidation. Final confirmation will be given once the downtrend is cleanly broken.
Im spot long.

I love this setup!💌We are seeing bottom trendline support holds + approaching previous resistance which should hold as support now.
RSI also at very oversold area,
This should wake up with bitcoin any day now. price targets are 16.25-21.04-28.68
💘goodluck! like and follow for more

🔴KDA 🔴has a continuation-bearish of symmetrical triangle 🔴💥Hi my Friends,
AS you see on the 4H chart
KDA has a symmetrical triangle (Continuation-Bearish)
Most probably will breakdown the trend line and retested again then will hit the support and get bounce from the support area as clearly mentioned on the chart
🟩Targets :-
🟢14.6
🟢21.2
🟢24.8
🟢28.3
As mentioned on the chart
🔴STOP LOSS
Close Daily below 8.4$
💥for investors 5.2 is very critical number to close below
🟩---------Not a financial advise--------------
💥 💥💥If you like my idea, give like and follow to receive all updates💥💥💥
--------------------------------------------Thanks---------------------------------


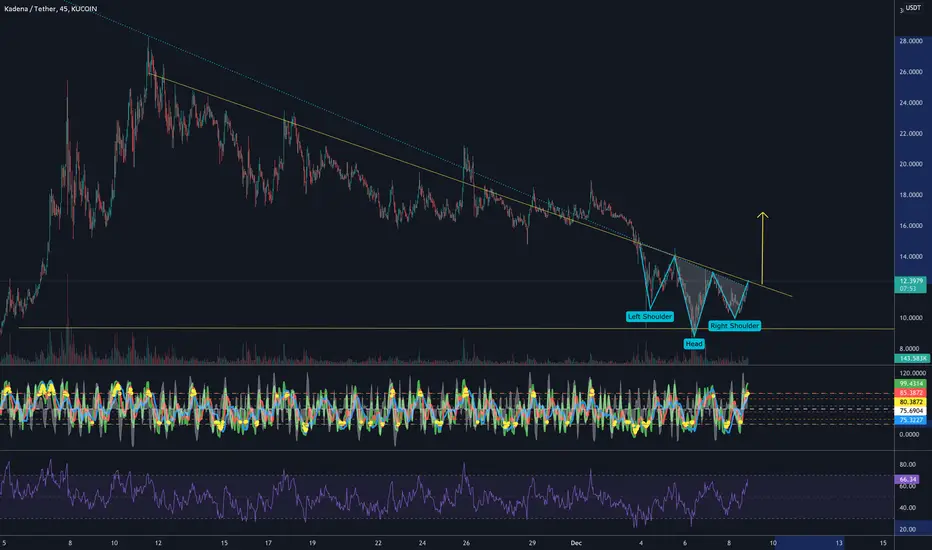
KADENA 132% potential s-h-sKDA due to its fast climb hard a heavy drop during this retracement.
It is forming an S-H-S pattern which will form a triangle and it will eventually break it through.
Appreciate the hard work by pressing like.
Happy trading,
Rafa