#KDA/USDT Stay Adaptive ?#KDA
The price is moving within a descending channel on the 1-hour frame, adhering well to it, and is on its way to breaking it strongly upwards and retesting it.
We have a bounce from the lower boundary of the descending channel. This support is at 0.4260.
We have a downtrend on the RSI indicato
Related pairs

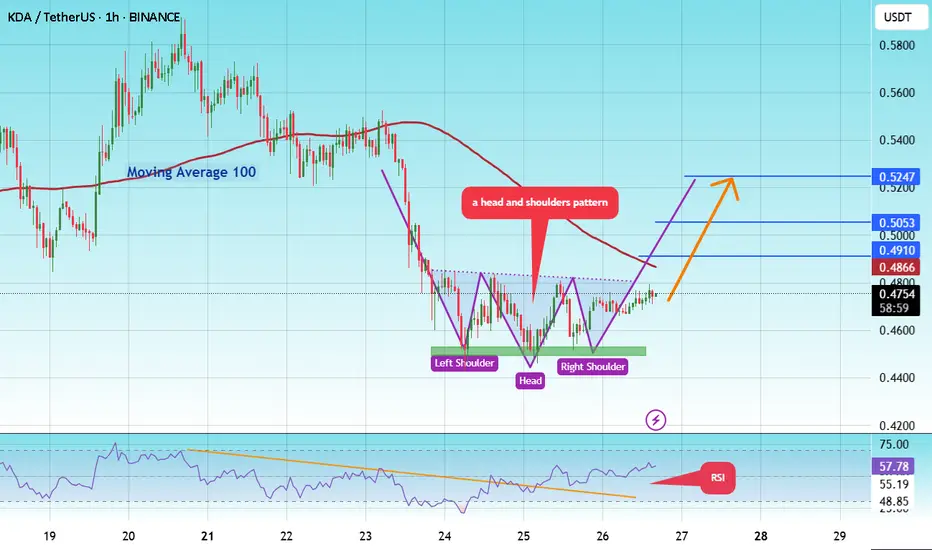
#KDA/USDT Stay Adaptive ! #KDA
The price is moving in a head and shoulders pattern on the 1-hour frame and is expected to break and continue higher.
We have a trend to stabilize above the 100 moving average once again.
We have a bearish trend on the RSI indicator, supporting the upward move with a break above it.
We have
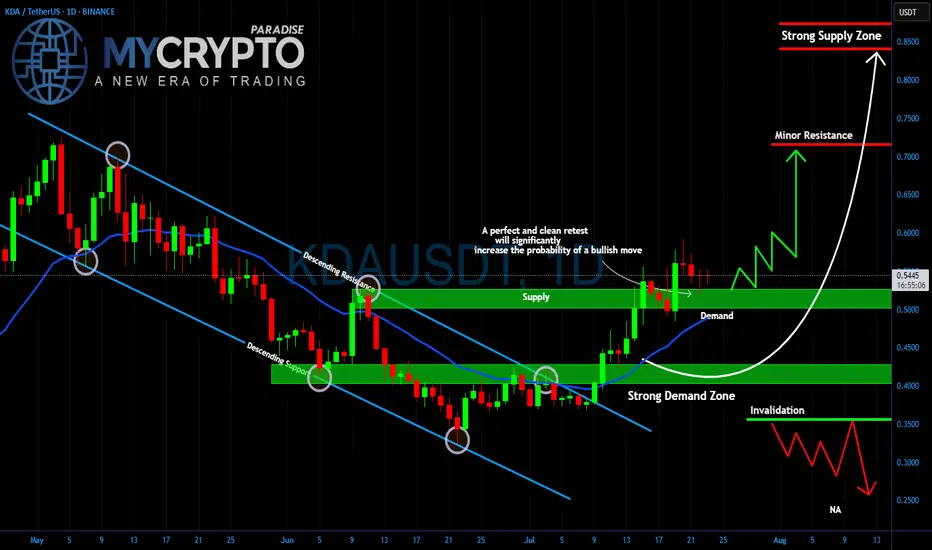
KDA Breakout or Fakeout? Critical Retest AheadYello Paradisers, is #KDA setting up for a major bullish move, or are we looking at another trap designed to wipe out impatient traders? The price has broken out of the descending channel that has been controlling the market for weeks, and now all eyes are on the retest.
💎The strong demand zone aro
$KDA giving this a shot
waiting on NY to add if given a sweep below vwap from swing low and confluence of demand
reclaimed 200 ema on daily
shall post update for HTF chart
KDAUSDT 1D#KDA has broken above the descending triangle and the Ichimoku cloud on the daily chart. It is also trading above all of the moving averages. Buy it here and near the support level at $0.4981.
Our targets are:
🎯 $0.6075
🎯 $0.6959
🎯 $0.7842
🎯 $0.9100
🎯 $1.0703
⚠️ Always use a tight stop-loss and ap

#KDA Kadena: Scalable PoW Layer 1 Setting Up for 10x+?📌 Coin: KDA (Kadena)
💰 Buy Levels:
✅ First Entry: $0.53
✅ Second Entry: $0.46
✅ Third Entry: $0.39
🛑 Panic / Invalidation: Weekly close below $0.33
🧠 Fundamental Analysis (FA) – In Short
*️⃣ Sector: Layer 1 blockchain / Scalable PoW
*️⃣ Use Case: Kadena is a high-throughput Proof-of-Work blockchain
KDA Breaks Trendline — Heading Towards $1?After a long period of consolidation, KDA has finally broken out of its descending trendline!
If the overall market sentiment remains bullish in the coming days, I believe KDA has the potential to break above $1 within a short period.
This is not an investment recommendation — just my personal anal

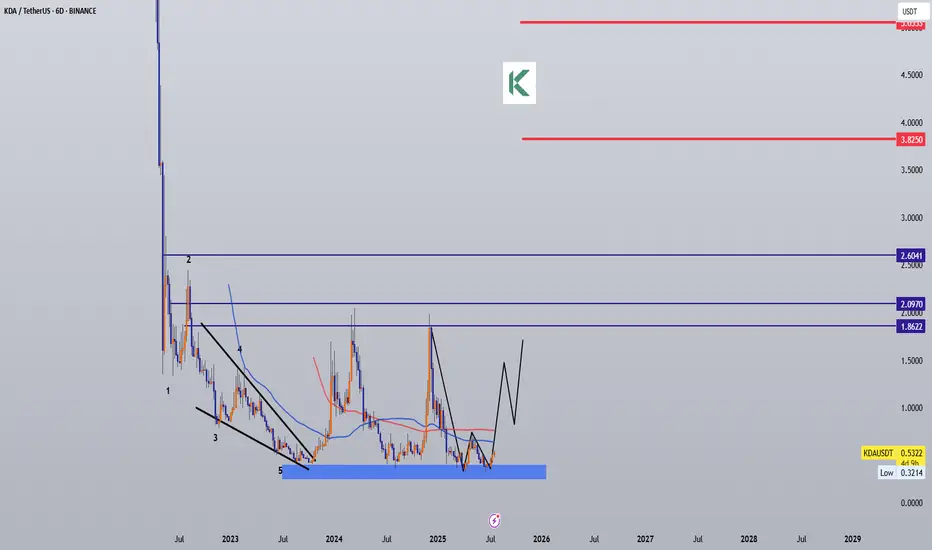
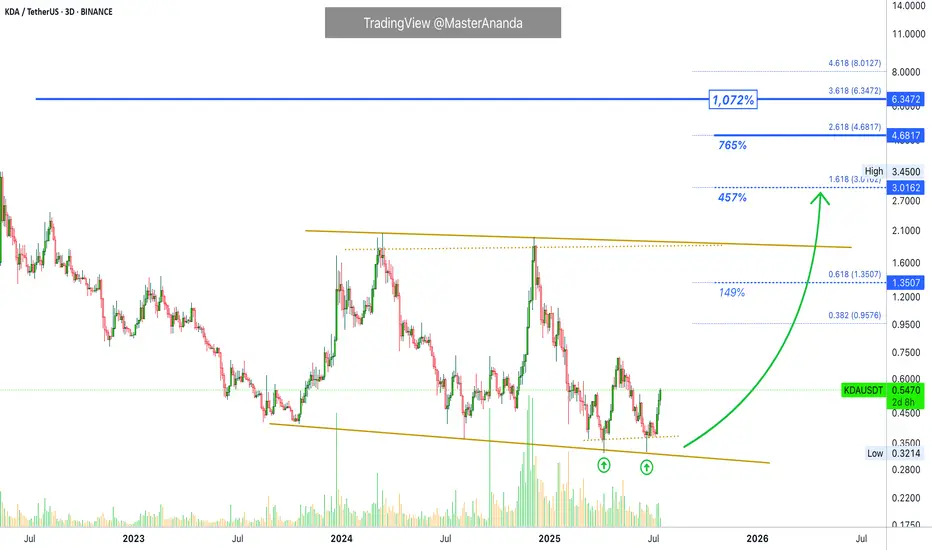
Kadena · 457% First Followed by Additional GrowthWhat should we be calling the first impulse? It is already here.
Good afternoon my fellow Cryptocurrency trader, the altcoins bull market is now.
It is already here. We are now seeing marketwide bullish action. There is only one variant present, one possible outcome only; increased bullish momentu
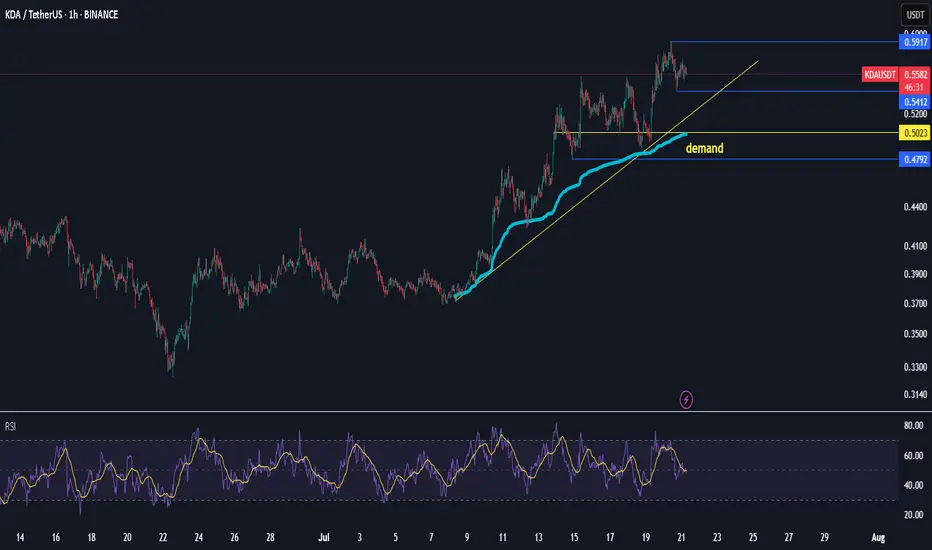
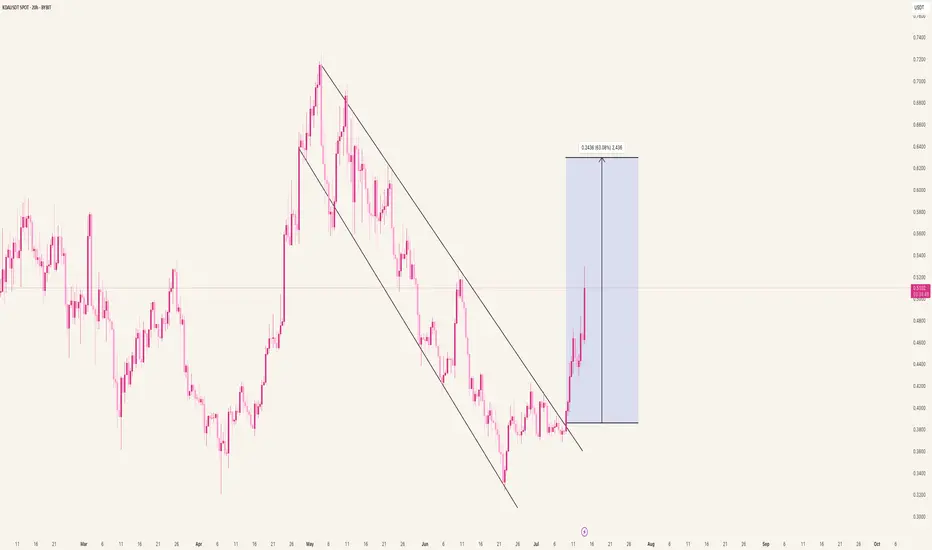
KDA/USDT – Bullish Reversal Confirmed: Clean Break from Falling Price broke out of a descending channel – clear bullish signal. We're seeing a strong impulse move, up +63% from the bottom, with room for continuation if momentum holds.
Breakout confirmed by a high-range candle. Watching for a possible retest of the breakout zone before the next leg up.
Watch le
#KDA/USDT UPDATE .#KDA
The price is moving within a descending channel on the 1-hour frame, adhering well to it, and is on its way to breaking it strongly upwards and retesting it.
We have a bounce from the lower boundary of the descending channel. This support is at 0.3665.
We have a downtrend on the RSI indicator

See all ideas
Summarizing what the indicators are suggesting.
Oscillators
Neutral
SellBuy
Strong sellStrong buy
Strong sellSellNeutralBuyStrong buy
Oscillators
Neutral
SellBuy
Strong sellStrong buy
Strong sellSellNeutralBuyStrong buy
Summary
Neutral
SellBuy
Strong sellStrong buy
Strong sellSellNeutralBuyStrong buy
Summary
Neutral
SellBuy
Strong sellStrong buy
Strong sellSellNeutralBuyStrong buy
Summary
Neutral
SellBuy
Strong sellStrong buy
Strong sellSellNeutralBuyStrong buy
Moving Averages
Neutral
SellBuy
Strong sellStrong buy
Strong sellSellNeutralBuyStrong buy
Moving Averages
Neutral
SellBuy
Strong sellStrong buy
Strong sellSellNeutralBuyStrong buy
Curated watchlists where KDAUSDT is featured.

Smart contracts: Make the smart decision
36 No. of Symbols
See all sparks
Frequently Asked Questions
The current price of Kadena/Tether USD (KDA) is 0.4348 USDT — it has fallen −0.63% in the past 24 hours. Try placing this info into the context by checking out what coins are also gaining and losing at the moment and seeing KDA price chart.
Kadena/Tether USD price has risen by 9.87% over the last week, its month performance shows a 12.66% increase, and as for the last year, Kadena/Tether USD has increased by 44.93%. See more dynamics on KDA price chart.
Keep track of coins' changes with our Crypto Coins Heatmap.
Keep track of coins' changes with our Crypto Coins Heatmap.
Kadena/Tether USD (KDA) reached its highest price on May 4, 2025 — it amounted to 0.7251 USDT. Find more insights on the KDA price chart.
See the list of crypto gainers and choose what best fits your strategy.
See the list of crypto gainers and choose what best fits your strategy.
Kadena/Tether USD (KDA) reached the lowest price of 0.3000 USDT on Apr 3, 2025. View more Kadena/Tether USD dynamics on the price chart.
See the list of crypto losers to find unexpected opportunities.
See the list of crypto losers to find unexpected opportunities.
The safest choice when buying KDA is to go to a well-known crypto exchange. Some of the popular names are Binance, Coinbase, Kraken. But you'll have to find a reliable broker and create an account first. You can trade KDA right from TradingView charts — just choose a broker and connect to your account.
Kadena/Tether USD (KDA) is just as reliable as any other crypto asset — this corner of the world market is highly volatile. Today, for instance, Kadena/Tether USD is estimated as 1.23% volatile. The only thing it means is that you must prepare and examine all available information before making a decision. And if you're not sure about Kadena/Tether USD, you can find more inspiration in our curated watchlists.
You can discuss Kadena/Tether USD (KDA) with other users in our public chats, Minds or in the comments to Ideas.