KADENA UPDATEKadena is currently in a strong position in the crypto space. The token has been trading around US $0.44–0.46 with healthy 24-hour volumes and signs of renewed traction. Its unique multi-chain Proof-of-Work architecture, Chainweb, allows the network to remain scalable, energy-efficient, and ready for enterprise-grade adoption. Recent developments, such as new EVM compatibility and tokenization partnerships, further strengthen its growth potential. Overall, Kadena appears well-positioned thanks to its price recovery and solid technical roadmap.
KDAUSDT trade ideas

#KDA/USDT Stay Adaptive ?#KDA
The price is moving within a descending channel on the 1-hour frame, adhering well to it, and is on its way to breaking it strongly upwards and retesting it.
We have a bounce from the lower boundary of the descending channel. This support is at 0.4260.
We have a downtrend on the RSI indicator that is about to be broken and retested, supporting the upside.
There is a major support area in green at 0.4186, which represents a strong basis for the upside.
Don't forget a simple thing: ease and capital.
When you reach the first target, save some money and then change your stop-loss order to an entry order.
For inquiries, please leave a comment.
We have a trend to hold above the 100 Moving Average.
Entry price: 0.4530
First target: 0.4625
Second target: 0.4754
Third target: 0.4932
Don't forget a simple thing: ease and capital.
When you reach the first target, save some money and then change your stop-loss order to an entry order.
For inquiries, please leave a comment.
Thank you.

#KDA/USDT Stay Adaptive ! #KDA
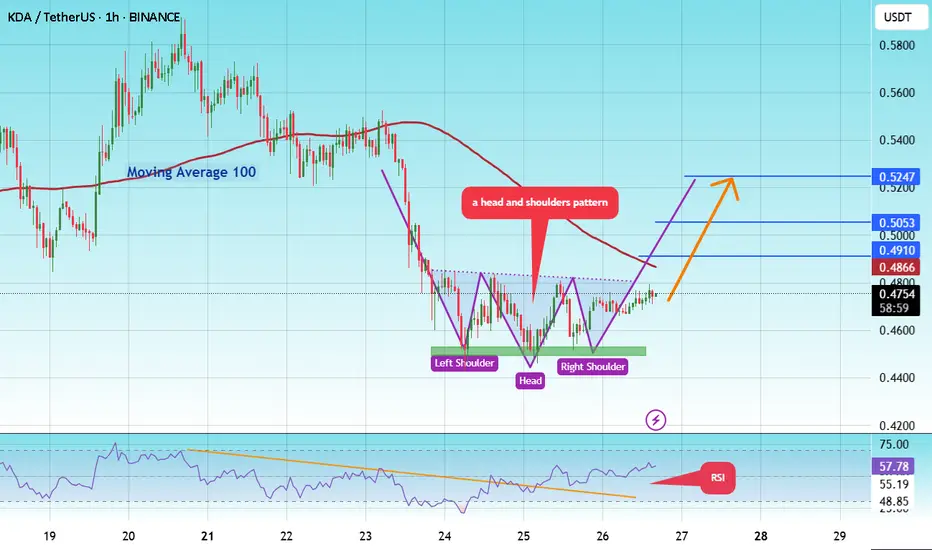
The price is moving in a head and shoulders pattern on the 1-hour frame and is expected to break and continue higher.
We have a trend to stabilize above the 100 moving average once again.
We have a bearish trend on the RSI indicator, supporting the upward move with a break above it.
We have a support area at the lower boundary of the head and shoulders at 0.4545, acting as strong support from which the price can rebound.
We have a major support area in green that pushed the price higher at 0.4490.
Entry price: 0.4747
First target: 0.4910
Second target: 0.5053
Third target: 0.5247
To manage risk, don't forget stop loss and capital management.
When you reach the first target, save some profits and then change your stop order to an entry order.
For inquiries, please comment.
Thank you.
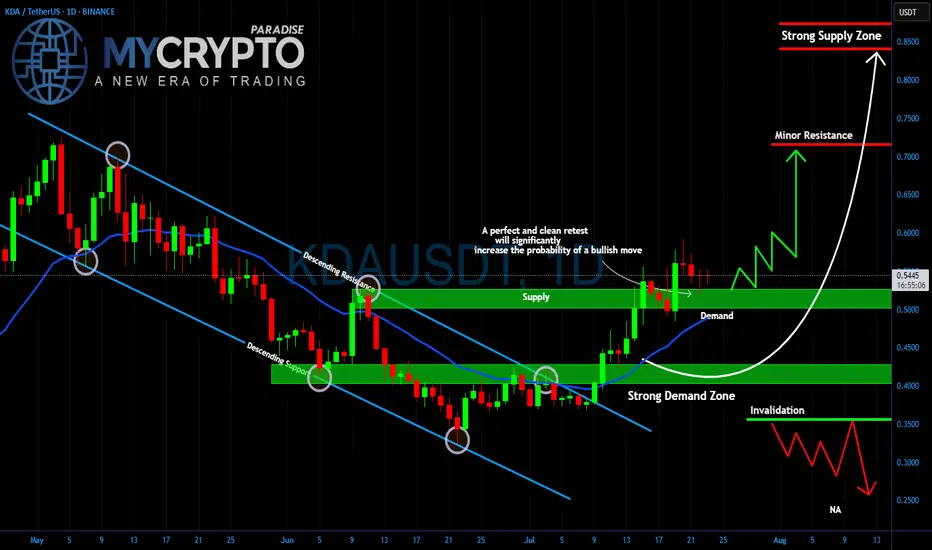
KDA Breakout or Fakeout? Critical Retest AheadYello Paradisers, is #KDA setting up for a major bullish move, or are we looking at another trap designed to wipe out impatient traders? The price has broken out of the descending channel that has been controlling the market for weeks, and now all eyes are on the retest.
💎The strong demand zone around $0.40–0.45 has been the key accumulation area for weeks, holding firmly every time the price dipped. Right now, #KDAUSDT is trading above the $0.50–0.55 demand level, which is acting as a critical support. A clean and confirmed retest of this zone would dramatically increase the probability of a bullish continuation.
💎If buyers step in aggressively, the first target will be the minor resistance at $0.70. Breaking above that could open the way for a push toward the strong supply zone at $0.85, where heavy selling pressure is expected. But if the demand fails and price drops below $0.35, this bullish scenario is invalidated, and a deeper move towards $0.25 becomes likely.
Trade smart, Paradisers. This game rewards patience and discipline, not reckless entries. Stick to your strategy, and you will stay ahead of the herd.
MyCryptoParadise
iFeel the success🌴
$KDA giving this a shot
waiting on NY to add if given a sweep below vwap from swing low and confluence of demand
reclaimed 200 ema on daily
shall post update for HTF chart
KDAUSDT 1D#KDA has broken above the descending triangle and the Ichimoku cloud on the daily chart. It is also trading above all of the moving averages. Buy it here and near the support level at $0.4981.
Our targets are:
🎯 $0.6075
🎯 $0.6959
🎯 $0.7842
🎯 $0.9100
🎯 $1.0703
⚠️ Always use a tight stop-loss and apply proper risk management.

#KDA Kadena: Scalable PoW Layer 1 Setting Up for 10x+?📌 Coin: KDA (Kadena)
💰 Buy Levels:
✅ First Entry: $0.53
✅ Second Entry: $0.46
✅ Third Entry: $0.39
🛑 Panic / Invalidation: Weekly close below $0.33
🧠 Fundamental Analysis (FA) – In Short
*️⃣ Sector: Layer 1 blockchain / Scalable PoW
*️⃣ Use Case: Kadena is a high-throughput Proof-of-Work blockchain designed for scalable smart contracts and industrial-grade apps.
*️⃣ Tech: Unique braided PoW with up to 20 chains in parallel for scaling. Built for security + speed without compromising decentralization.
*️⃣ Smart Contracts: Runs on Pact, a secure and human-readable smart contract language with formal verification.
*️⃣ Narrative Fit: Kadena positions itself as the only scalable PoW chain, blending Bitcoin’s security model with Ethereum’s contract functionality.
📊 Tokenomics & Market Data
(As of mid-July 2025)
🪙 Current Price: ~$0.50
🧾 Market Cap: ~$130M
🔢 Rank: #230–260 range
🧮 Circulating Supply: ~260M KDA
🔒 Max Supply: 1B KDA
⛏️ Emissions: Mining-based (PoW), inflationary but decreasing
📦 Unlock Schedule: Gradual over 120 years; team and ecosystem share unlocking ongoing
🎯 Bull Market Target (Realistic)
Target Range: $1.60 – $2.20
*️⃣ A return to former range highs from early 2023 before breakdown, reflecting growing ecosystem and rediscovery of undervalued L1s.
🚀 Mega Bullish Target (Speculative Top)
Target Range: $5.00 – $7.50+
*️⃣ Would require mass recognition of Kadena as a scalable PoW solution, and a strong narrative rotation into energy-secure and decentralization-focused chains.
✅ Final Take
🧠 Kadena is a technically unique L1 with solid fundamentals and huge upside if the PoW vs PoS narrative reignites.
we ask Allah reconcile and repay
KDA Breaks Trendline — Heading Towards $1?After a long period of consolidation, KDA has finally broken out of its descending trendline!
If the overall market sentiment remains bullish in the coming days, I believe KDA has the potential to break above $1 within a short period.
This is not an investment recommendation — just my personal analysis.
What’s your opinion?

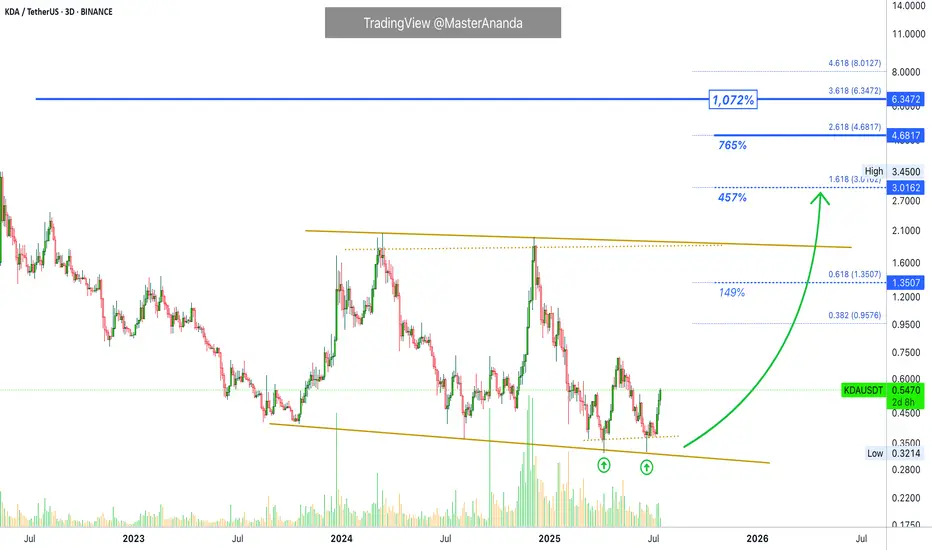
Kadena · 457% First Followed by Additional GrowthWhat should we be calling the first impulse? It is already here.
Good afternoon my fellow Cryptocurrency trader, the altcoins bull market is now.
It is already here. We are now seeing marketwide bullish action. There is only one variant present, one possible outcome only; increased bullish momentum. From now on, you will see daily bullish momentum grow.
Kadena is ready to move higher. The current move will produce a minimum of 450%, and this won't be all this project has to offer, this will signal the end of the first portion of the bullish wave. There will be additional growth after a stop after this first target is hit.
Since 9-July we have only full green candles. There will be more, more and more. Trust and you will be rewarded. Hold now, buy (yesterday), sell in several weeks or in a matter of months. You can sell—when prices are high—just to buy back lower when the correction comes. You can sell and move to a new trading pair because there will be hundreds of options blowing up.
This is just a friendly reminder. The time is now. 100% certainty.
We are moving ahead. Profits are yours to make.
Namaste.
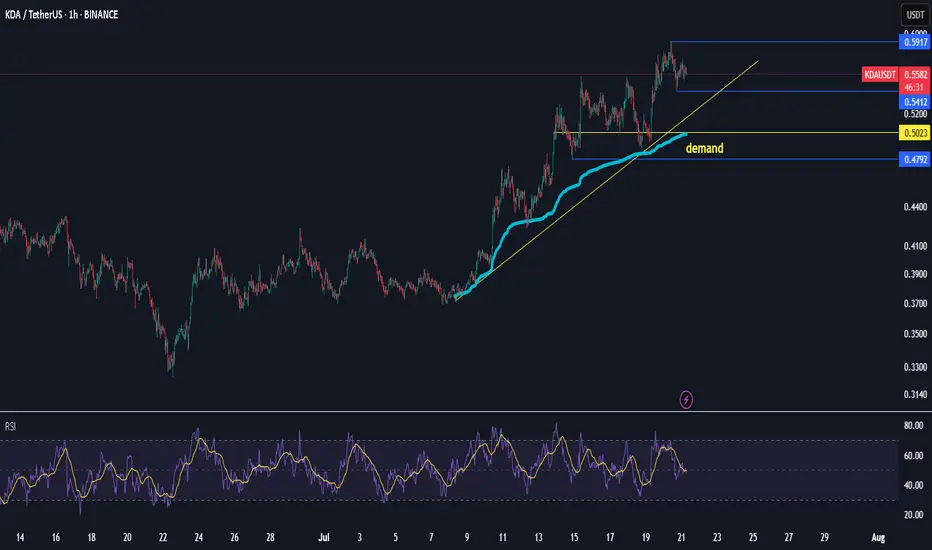
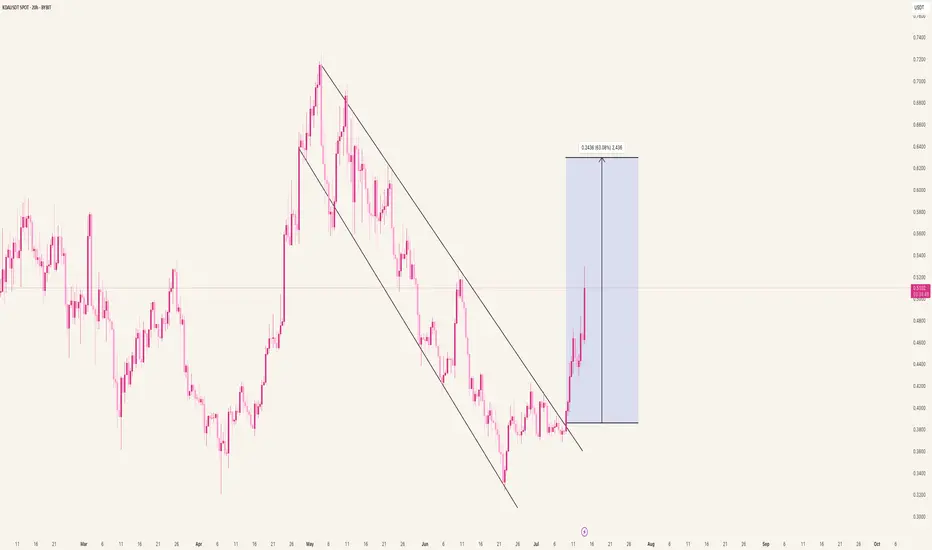
KDA/USDT – Bullish Reversal Confirmed: Clean Break from Falling Price broke out of a descending channel – clear bullish signal. We're seeing a strong impulse move, up +63% from the bottom, with room for continuation if momentum holds.
Breakout confirmed by a high-range candle. Watching for a possible retest of the breakout zone before the next leg up.
Watch levels:
Breakout trigger: 0.39
Target: 0.62
Invalidation: below 0.35
Wedge breakout in play, don’t miss the next ones. Follow for more high-precision setups.
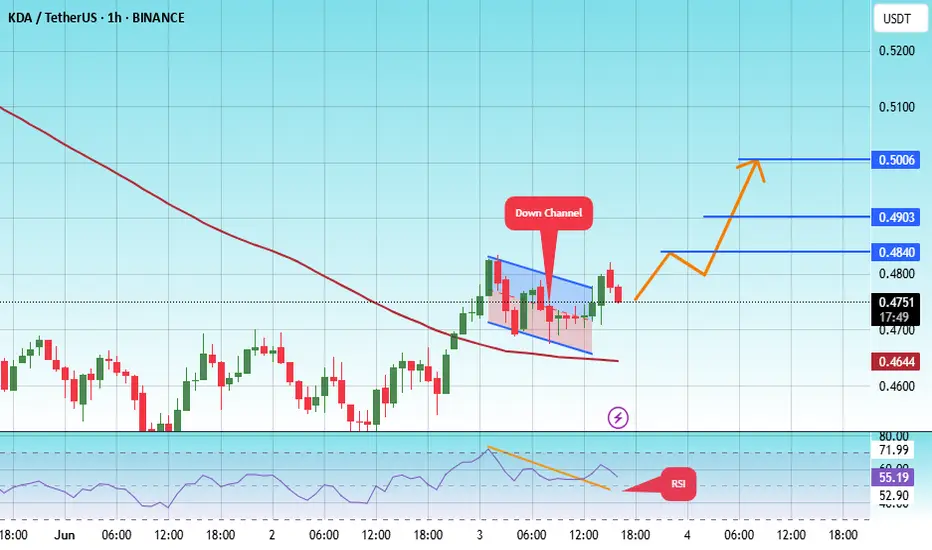
#KDA/USDT UPDATE .#KDA
The price is moving within a descending channel on the 1-hour frame, adhering well to it, and is on its way to breaking it strongly upwards and retesting it.
We have a bounce from the lower boundary of the descending channel. This support is at 0.3665.
We have a downtrend on the RSI indicator that is about to be broken and retested, supporting the upside.
There is a major support area in green at 0.3663, which represents a strong basis for the upside.
Don't forget a simple thing: ease and capital.
When you reach the first target, save some money and then change your stop-loss order to an entry order.
For inquiries, please leave a comment.
We have a trend to hold above the 100 Moving Average.
Entry price: 0.3824
First target: 0.3909
Second target: 0.4041
Third target: 0.4195
Don't forget a simple thing: ease and capital.
When you reach the first target, save some money and then change your stop-loss order to an entry order.
For inquiries, please leave a comment.
Thank you.

If you bought Kadena last cycle...you have to be DCA'ing in this zone, to give yourself a chance to exit with some gains in the upcoming pump.

KDA/USDT – Major Reversal Brewing from Multi-Year Demand Zone?🔍 Technical Breakdown – Weekly Timeframe
Kadena (KDA) is currently trading at a make-or-break level after months of persistent downtrend. The price is revisiting a historical multi-year demand zone between $0.31 - $0.45, an area that previously acted as a launchpad for major rallies.
This range has consistently attracted buyers, forming a strong base of accumulation, as observed in mid-2021 and mid-2022. Now, once again, KDA is testing this critical zone — and all eyes are on whether it will spark the next impulsive leg up.
🧠 Pattern Structure:
Price has formed a potential Triple Bottom / Rounded Accumulation pattern on the weekly chart.
Strong bullish divergence is visible (if confirmed by RSI or MACD).
Long-term sideways consolidation hints at phase of accumulation, common before breakout rallies.
A clean break above local resistance zones may trigger a multi-level Fibonacci extension rally.
🟢 Bullish Scenario:
If price holds and confirms a rebound from this yellow demand box, watch for a bullish breakout with the following key resistance targets:
1. 🔹 $0.6277 – Minor local resistance
2. 🔹 $0.8354 – Former swing high (early 2024)
3. 🔹 $1.1000 – Psychological & structural level
4. 🔹 $1.3567 – Weekly resistance
5. 🔹 $1.7615 – Medium-term target zone
💥 Extension Targets for Macro Bulls:
$5.5285 – Previous major high
$7.6381 – Major resistance from 2022
$15.3227 and $21.9739 – Long-term fib levels from all-time high retracement
✅ Bullish confirmation requires a weekly close above $1.10 with rising volume and higher highs.
🔴 Bearish Scenario:
If price closes below $0.31 with strong bearish momentum:
Expect continuation of macro downtrend.
No strong support structure below; risk of falling into uncharted territory or sub-$0.20 levels.
Breakdown could lead to capitulation and extended bear phase.
⚠️ Manage risk accordingly. Invalidating the current demand zone could shift the entire structure to a distribution model.
📊 Market Psychology & Volume Profile Insight
Extended sideways action and low volatility can signal the end of bearish momentum.
A breakout from this long-term base often leads to explosive upside as weak hands are flushed out.
Volume spikes near the bottom zones indicate smart money accumulation.
🧭 Strategic Note for Traders:
This setup offers a high reward-to-risk ratio, especially for swing and position traders. Early entry within the accumulation zone with tight stop-loss (below $0.30) could provide a golden opportunity — but only if confirmed with volume and price strength.
#KDAUSDT #Kadena #CryptoBreakout #AltcoinAnalysis #TechnicalAnalysis #SupportAndResistance #TripleBottom #BullishSetup #CryptoSignals #AccumulationPhase


#KDA/USDT#KDA
The price is moving within a descending channel on the 1-hour frame, adhering well to it, and is heading for a strong breakout and retest.
We are seeing a rebound from the lower boundary of the descending channel, which is support at 3370.
We have a downtrend on the RSI indicator that is about to be broken and retested, supporting the upward trend.
We are looking for stability above the 100 moving average.
Entry price: 0.3420
First target: 0.3526
Second target: 0.3646
Third target: 0.3800

KDAUSDT 1W Analysis KDA ~ 1W Analysis
#KDA This is the lowest support for now. Buy if you still have confidence in this coin with a short term target of at least 15%+ from this support.

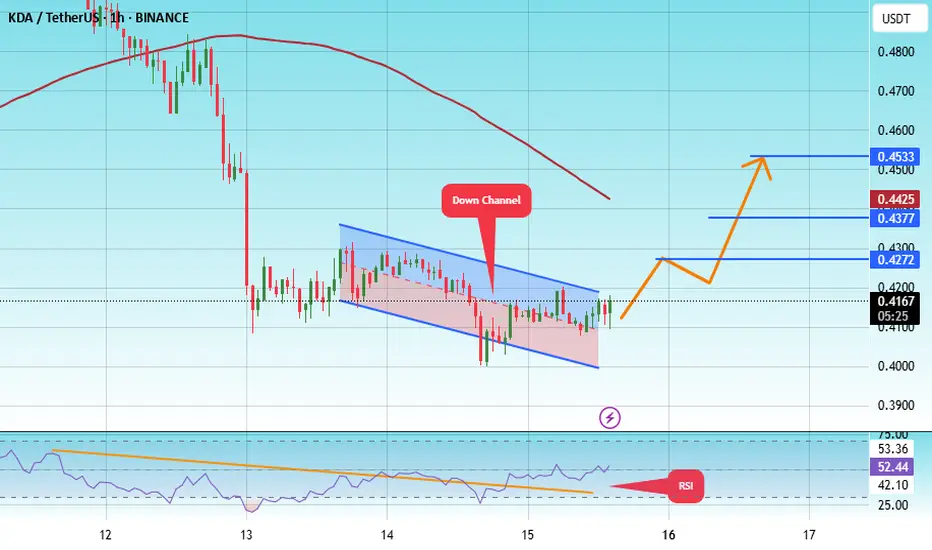
#KDA/USDT#KDA
The price is moving within a descending channel on the 1-hour frame, adhering well to it, and is heading toward a strong breakout and retest.
We are experiencing a rebound from the lower boundary of the descending channel. This support is at 0.4043.
We are experiencing a downtrend on the RSI indicator, which is about to break and retest, supporting the upward trend.
We are heading toward stability above the 100 Moving Average.
Entry price: 0.4167
First target: 0.4274
Second target: 0.4377
Third target: 0.4533
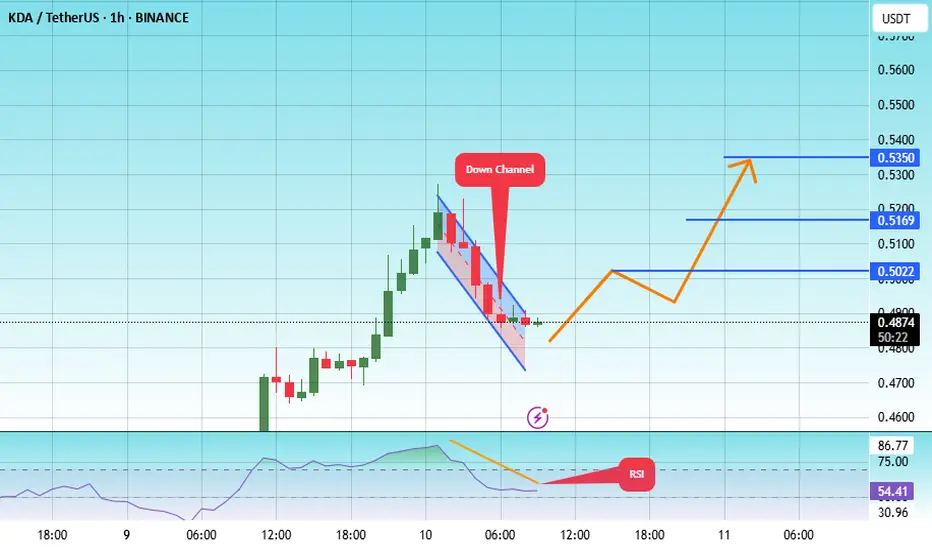
#KDA/USDT#KDA
The price is moving within a descending channel on the 1-hour frame, adhering well to it, and is heading toward a strong breakout and retest.
We are experiencing a rebound from the lower boundary of the descending channel. This support is at 0.4770.
We have a downtrend on the RSI indicator that is about to be broken and retested, supporting the upward trend.
We are heading toward stability above the 100 moving average.
Entry price: 0.4887
First target: 0.5022
Second target: 0.5170
Third target: 0.5350
#KDA/USDT#KDA
The price is moving within a descending channel on the 1-hour frame, adhering well to it, and is heading for a strong breakout and retest.
We are seeing a rebound from the lower boundary of the descending channel, which is support at 0.5780.
We have a downtrend on the RSI indicator that is about to be broken and retested, supporting the upward trend.
We are looking for stability above the 100 moving average.
Entry price: 0.6033
First target: 0.6330
Second target: 0.6625
Third target: 0.7011

#KDA/USDT#KDA
The price is moving within a descending channel on the 1-hour frame, adhering well to it, and is heading for a strong breakout and retest.
We are experiencing a rebound from the lower boundary of the descending channel. This support is at 0.4670.
We are experiencing a downtrend on the RSI indicator, which is about to break and retest, supporting the upward trend.
We are looking for stability above the 100 Moving Average.
Entry price: 0.4764
First target: 0.4840
Second target: 0.4900
Third target: 0.5000
#KDA/USDT#KDA
The price is moving within a descending channel on the 1-hour frame and is expected to break and continue upward.
We have a trend to stabilize above the 100 moving average once again.
We have a downtrend on the RSI indicator that supports the upward move with a breakout.
We have a support area at the lower limit of the channel at 0.4333, acting as strong support from which the price can rebound.
Entry price: 0.4422
First target: 0.4487
Second target: 0.4566
Third target: 0.466

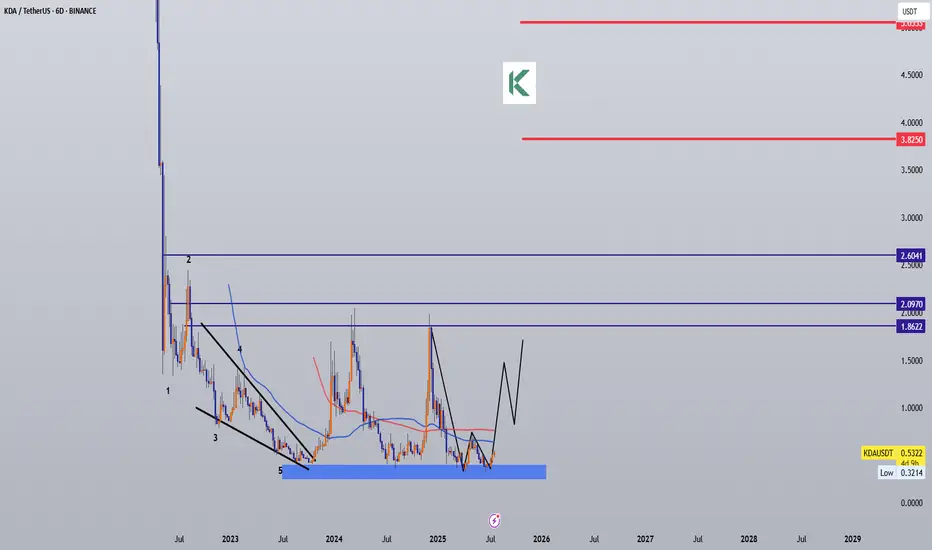
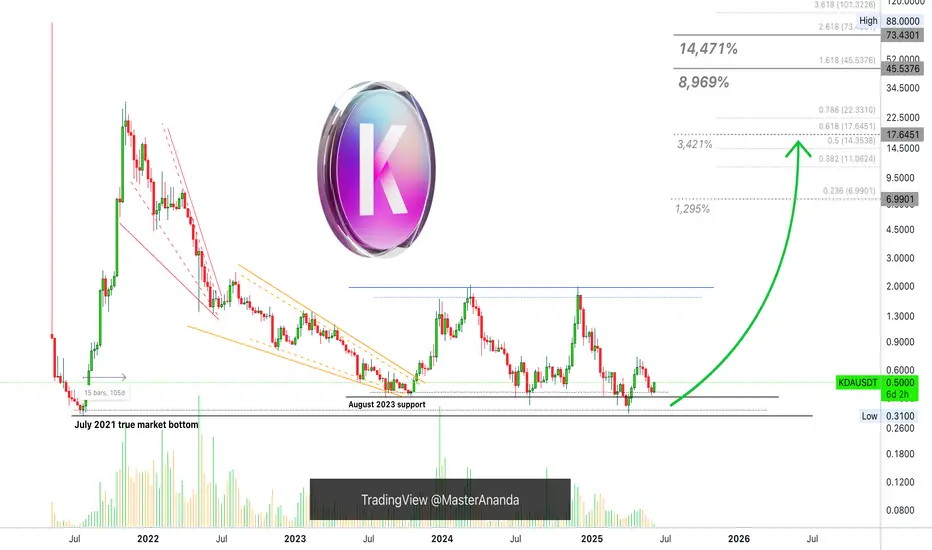
Kadena, Is 14,471% Truly Possible In 2025? Read The Chart!I love Kadena's previous bull-market. From July 2021 through November 2021, it was pure joy, straight up; huge profits of course.
It lasted 105 days... Total growth almost 9,000% and then the market went bearish, and then the market went sideways, for years... I think this time we will experience something awesome like the last time. It only happens every four years do you agree?
Cryptocurrency goes wild every four years, it is what it is.
So 2021 leads to 2025. It is already mid-2025 and we are ready... So ready, yes ready, truly ready... Yes!
We are ready and the price, and the chart and the markets, the candles, the signals it all looks great. Ready for new growth and new high-profits Cryptocurrency millionaire, let's trade!
KDAUSDT. The August 2023 support was also the July 2024 support, August 2024, February 2025 and now June 2025 as a higher low. The April 2025 low pierced through this level and that's the reason why the chart now looks great, because KDAUSDT is trading back-above it, the August 2023 low. Being above this level means ultra-bullish.
Anyway, we have huge potential for growth on this pair. Kadena has an easy target of 1,295%, that being $6.99. A strong target for 3,421% at $47.65.
There is an ATH at $45 for 8,969% and another one at $73 for 14,471%.
Thank you for reading.
Namaste.
KDA (SPOT)BINANCE:KDAUSDT
#KDA/ USDT
Entry( 0.42- 0.47)
SL 1D close below 0.4131
T1 1.00
2 Extra Targets(optional) in chart, if you like to continue in the trade with making stoploss very high.
______________________________________________________________
Golden Advices.
********************
* collect the coin slowly in the entry range.
* Please calculate your losses before the entry.
* Do not enter any trade you find it not suitable for you.
* No FOMO - No Rush , it is a long journey.
