KADENA, MY PREDICTED SCENARIO...! For this scenario to occur, the compressed density needs to be broken.
Keep in mind that this is only a possible scenario and the purchase must be made with your consideration.
-Thanks-
KDAUSDT trade ideas

if you think kadena will break above the blue linethen use code 'kdanian' to buy kda on coinmetro :-)


KDA/USDT 15m timeframeaccording to an Elliot wave;
- KDA could have a leg up to the first target area (orange arrow) which is between the 0.5 & 0.618 fib levels of the Elliot wave A length
- or KDA could retrace to the black line which is the 1.618 fib level of the wave A and then bounce up
- also there is a bullish TK cross
- 2nd target area is the top of the ichimoku cloud which would be valid if there was multiple candle closes in the cloud


KDA/USDT 15m timeframe- double bottom
- could range for a few hours then break out towards the top of the ichimoku cloud
- there is a bearish TK cross & a large gap between the conversion line and base line, but these 2 bearish indications could be invalid and cancel out due to the drop that has already happened.
- i believe KDA should recover in the next few hours

KDA/USDT 3hr timeframe- bullish TK cross
- target for breakout is the top of the ichimoki cloud as there has been multiple candle closes in the cloud
- above EMA 9,21 & 50
- above MA 9,21 & 50
- there is a double top though, which could force KDA down slightly

The next target for Kadena is 15.5 USDIn order for the trend to reach the 4th point, it needs to reach the resistance of 15.5. Considering that KDA is at the top of the altcoins with a bright future, t his target is not difficult to reach.
I’m not a certified financial planner/advisor, a certified financial analyst, an economist, a CPA , an accountant, or a lawyer. I’m not a finance professional through formal education. The contents on this site are for informational purposes only and do not constitute financial, accounting, or legal advice. I can’t promise that the information shared on my posts is appropriate for you or anyone else. By using this site, you agree to hold me harmless from any ramifications, financial or otherwise, that occur to you as a result of acting on information found on this site.

kadena's about to chart its own pathkda bout to break away from btc. pretty exciting to see. hoping to scalp a quick 20%

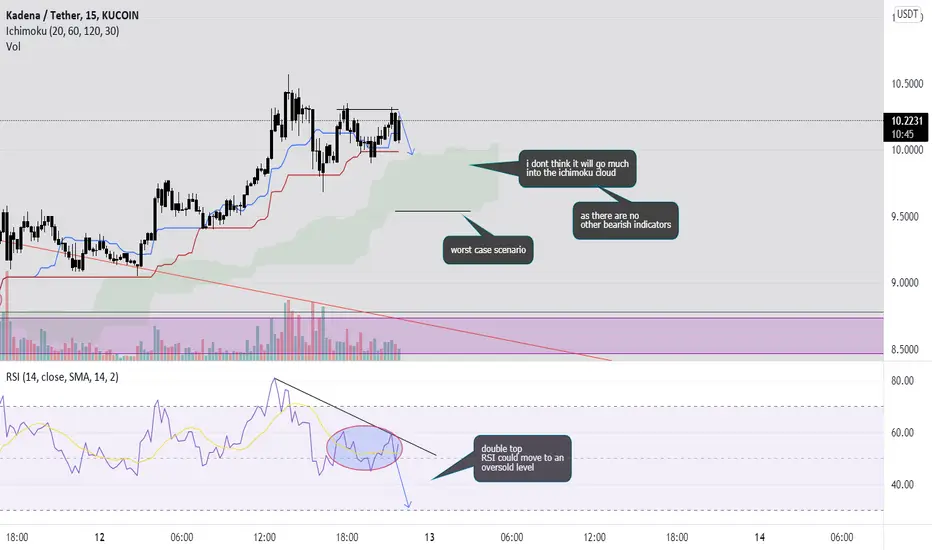
KDA/USDT 15m timeframe- double top on the 15m chart
- i dont think KDA will drop that much as there are no other bearish indicators
- worst case scenario is KDA drops to the bottom of the ichimoku cloud
- double top on the RSI, could move to an oversold level (below 30) which would be bullish
KDAUSDT expectationMovement expectation for KDAUSDT.
We will look for the first blue rectangle before retracing to buy zone and then go for sell zone 1.

KDA/USDT on a 4hr chart- trendline broken as predicted yesterday
- bullish TK cross as predicted yesterday
- target for breakout is the top of the ichimoku cloud

KDA/USDT 15m timeframe- about to be a bullish TK cross
- bullish RSI
- volume coming into KDA
- can we break the trendline?

KDA/USDT on a 4hr chart- double bottom
- bullish RSI
- hopefully can break the trendline
- however there is a large gap between the conversion line and base line which indicates a retracement

Alternate view on kdaLast time i posted the idea of a ABC correction wave tl 8$ , folowed by a 5 wave impuls to 28$ to form a Shark pattern.
This time, it seems kda is moving into a triangle and might be doing a zigzag move to the bottem.
Seeing where btc is going, still very bearish, the suport at 40k held, i expect a bounce back to 43-45k and than range for a couple of weeks, but eventually btc wil bottem to 38k, eth to 2600 before turning around, and i expect kda to do the same. I dont see btc turning bulish in Q1.
So kda math might bounce from here top of buy range 8$, to top of triangle resistance at 12$ and a last dive to 6$. Im buying end of this week at 8$ (pbb thursday), ride the 50%+ wave to 12$, sell there, and buy back in at 6$, and from there hold till 2023. 6$ is Insane buy price.
Tp1 40 Q2
Tp2 80 Q3 bnb listing
Tp3 240 Q4 parabolic cycle top
No trading advice. Just alternate view on kda.


Kadena BUY SETUP Hi everyone if you like the idea or setup please give it a like and a follow
Here’s a requested analysis on Kadena
Seems to be a a good entry level at the time, market pulled back to our Fibonacci magic level of 0.61 completing its pullback, market hasn’t gone too far from the price since then and most times when markets move sideways it only means its accumulating and getting orders in and getting ready to move.
As always, Be patient, but don’t time the markets

KDAJust look at the scribbles. I believe it will go down long term this is just another opportunity to sell higher if it goes up. I was selling only in thousands previous peaks i will try tens of thousands now and rebuy for my dreamy lucky $7. Worst that can happen is sell for $15 and buy for $10. Those are achievable targets imo. I will might reach $20 after listing on Binance for now its crab season.


KDAUSDT , going up?Let me know what do you think please like , follow and comment what coin you want to be analysed.
It's not an advice to buy or sell , do your own research

KDA/USDT 15m timeframe- Continuation of the last KDA chart posted
- There is an inverse head and shoulders forming which is clearer to see on the lined chart rather than the candle chart
- The target if the inverse head and shoulders plans out is around $9.20 as it is the top of the ichimoku cloud

KDA/USDT on a 15m chart- large gap between the conversion line and base line
- bearish TK cross
- support at $8.7 has broken
- potential support at $7.5
- hopefully BTC can just find its bottom and we continue
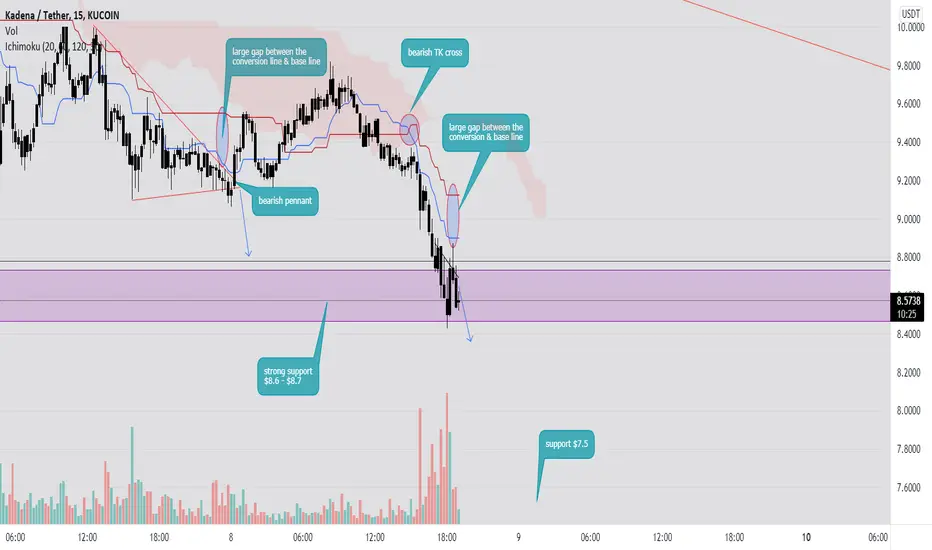
KDA 15m timeframe. is it heading down lower...?- bearish pennant formed
- large gap between the base layer & conversion layer
- strong support on the fib level around $8.8 if the price does drop
- if fib level breaks theres also a strong support around $8.6
