✴️ Kadena Update by Request (1,011% Potential Mid-Term)We already know the bigger picture, long-term, based on past trade ideas. I will add this at the bottom of this post.
👉 Medium-term we have more than 1,000% possible and here is the chart:
We are "talking" about Kadena, KDAUSDT.
Short-term, we saw a break and close below EMA10 and so the potential for a retrace.
The bullish bias is still strong and should remain valid/active for the weeks and months to come.
This is not financial advice.
All the information is shared for educational purposes only.
Thanks a lot for your continued support.
Namaste.
KDAUSDT trade ideas


KDA/USDT - Kadena: BBand Breakout◳◱ On the $KDA/ CRYPTOCAP:USDT chart, the Bband Breakout pattern suggests an upcoming trend shift. Traders might observe resistance around 0.624 | 0.642 | 0.678 and support near 0.588 | 0.57 | 0.534. Entering trades at 0.724 could be strategic, aiming for the next resistance level.
◰◲ General info :
▣ Name: Kadena
▣ Rank: 224
▣ Exchanges: Binance, Kucoin, Bybit, Gateio, Bittrex, Hitbtc
▣ Category/Sector: Infrastructure - Smart Contract Platforms
▣ Overview: Kadena is a public blockchain that aims to optimize for scalability and features a new smart contract language, dubbed Pact, which comes equipped with formal verification and upgradeable smart contracts. Kadena also uses a new Proof-of-Work (PoW) consensus mechanism called Chainweb that consists of multiple individually mined chains working in parallel to execute network transactions. This design theoretically supports a high-transaction throughput at the base-layer without the need for any second-layer scalability or functionality solutions.
◰◲ Technical Metrics :
▣ Mrkt Price: 0.724 ₮
▣ 24HVol: 9,573,144.443 ₮
▣ 24H Chng: 16.963%
▣ 7-Days Chng: 18.22%
▣ 1-Month Chng: 27.38%
▣ 3-Months Chng: 52.95%
◲◰ Pivot Points - Levels :
◥ Resistance: 0.624 | 0.642 | 0.678
◢ Support: 0.588 | 0.57 | 0.534
◱◳ Indicators recommendation :
▣ Oscillators: SELL
▣ Moving Averages: STRONG_BUY
◰◲ Technical Indicators Summary : BUY
◲◰ Sharpe Ratios :
▣ Last 30D: 2.51
▣ Last 90D: 1.84
▣ Last 1-Y: -0.38
▣ Last 3-Y: 0.97
◲◰ Volatility :
▣ Last 30D: 0.82
▣ Last 90D: 0.68
▣ Last 1-Y: 0.74
▣ Last 3-Y: 1.41
◳◰ Market Sentiment Index :
▣ News sentiment score is N/A
▣ Twitter sentiment score is 0.71 - Bullish
▣ Reddit sentiment score is 0.74 - Bullish
▣ In-depth KDAUSDT technical analysis on Tradingview TA page
▣ What do you think of this analysis? Share your insights and let's discuss in the comments below. Your like, follow and support would be greatly appreciated!
◲ Disclaimer
Please note that the information and publications provided are for informational purposes only and should not be construed as financial, investment, trading, or any other type of advice or recommendation. We encourage you to conduct your own research and consult with a qualified professional before making any financial decisions. The use of the information provided is solely at your own risk.
▣ Welcome to the home of charting big: TradingView
Benefit from a ton of financial analysis features, instruments and data. Have a look around, and if you do choose to go with an upgraded plan, you'll get up to $30.
Discover it here - affiliate link -

KDAUSDTKDA price will go up in the upcoming days.
Currently, it is in a dubious state.
Keep your SL with a fair gap with the recent price
It is just a speculation

KDAUSDT setup for a bull moveBig bull divergence on RSI 3d dayframe. Even greater bullish divergence on the KDA/BTC pair.
Currently moving inside the Ichi cloud, expecting a move towards the top of the cloud.
Bull flag with target on the top of the ichi cloud.
I consider this a good R/R ratio.

KDA/TOTAL BULLISHHi! Its the most bullish chart of kadena for me. The chart shows the dominance of kadena over others.

KDA showing a very impressive investment opportunityHi Everyone;
today we have one of the best risk to reward Investment opportunity
it is more than 1880 times the risk and the chart is look very promising.
I expect breaking the previous bear market key point will clear the way to the final target

Kadena buying zone I see the red zone as a perfect buying zone for kadena . It contains fib cluster ,hosoda target , and demande zone .
Not a financial advice.
Thank you .

Kadena ultimate buying price for the next bull run In the chart , i indicated 2 zones , the first zone is a monthly demande zone 0.35$ . The second zone between the 2 lines , they indicate the 2020 and 2021 yearly open , for me 0.18-0.15 is the ultimate buying zone for KDA , where you can have the optimale roi in kda .
Todays price are good prices where you can dca , the prices indicated in the chart are not guaranteed , and not finnacial advice .
Thank you

KDA/USDT bullish horizons? 👀 🚀 Kadena Today analysis
💎 Paradisers, brace yourselves for a promising venture with KDAUSDT. The asset is currently navigating within a demand zone, signaling a heightened likelihood of a bullish trajectory.
💎 A recent development to highlight is its break from a descending trendline, which previously acted as resistance. This upward shift is further accentuated by the transformation of an overhead supply into a demand zone, bolstering bullish sentiments. Given its current position within the demand zone, the odds favor a bullish surge.
💎 Should this bullish momentum persist, the initial expectation is a retest of the .561 resistance level. A breach of this threshold could further amplify the chances of challenging a more formidable resistance level above.
💎 On the flip side, if the price descends below the current demand zone, there's a probability it might revisit the trendline once again

Strong Bullish will be start as soon hello dear
as you can see in the chart KDA/USDT is braekout 0.61 , the next resistance is 1.1-1.4$ , I hope breakout this key resistor because after that Second Bullish Trend will start until 10$-24$

KDA needs to break downward trend ASAP!!!KUCOIN:KDAUSDT
Common FWB:KDA , do something!!! lol.
$KAS is always pumping almost everyday, week and months while you still in the downtrend.
When lambo????

KADA ON WAY TO RETURN TO LEVEL OF APRIL $1Kada is making new levels for the next break to $1
There is signals of high volume for the coming time.

KDA/USDTKadena one of the best blockchains.
If kadena price rich 0.512$ after that next level is 0.62$
Thank you

KDA/USDTFWB:KDA
nice breakout from falling wedge pattern, if you measure inside of the wedge you are able to see the potential target of 94 cents!

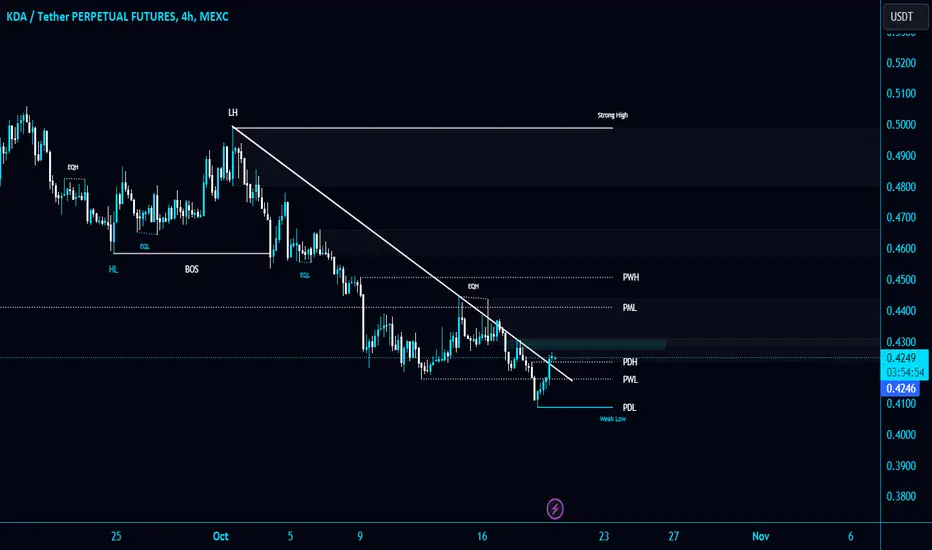
#KDA/USDT breaking the Diagonal Trendline in 4-Hour TF!#KDA/USDT breaking the Diagonal Trendline in 4-Hour TF!
Wait for $0.43 breakout to open a long position. The first local support level is PWL $0.418. The first local resistance level of $KDS is $0.441.
KDAUSDThi snipers. In the one-day time frame, we see the price of KDA approaching the upper line of its long-term descending channel. In case of a breakout and stabilization of the price, we can expect the price to rise to high resistances. Nothing is impossible. Analyzes It is only a possibility and not an byu or sale.

#KDAUSDT IDEAFWB:KDA has a strong bullish momentum, currently retest on MA89 and Ichiomoku cloud resistance, im looking for LONG trade after bounce back from resistance to 0.47 support zone.
Entry: 0.433 - 0.4117
SL: 0.3922
TP 1: 0.608
TP 2: 0.725
Not a financial advice, please manage your risk

KDA - Great level to $tart DCA, very over$old on many timeframe$KDA Kadena is a very solid project. We have been following it for a long time.
Currently it is seriously oversold and it presents an opportunity to start looking for an entry.
Follow the analysis in the video to find out why we believe so.
Thank you for watching! Comments and feedback are always welcome :)

kda 4HHello friends, be careful with this currency
We can offer prices between 0.40-376
Let's see good growth

Kadena 14 days fallThe structure is first the price find a low and make a double top then break the uptrend lower low too lower low line after this its fall 4 origin line but every fall is weaker and faster. The first fall 4 lines for 45 days then 3 lines for 25 days so probably the next fall take 2 lines and 14 days. My target is 0.37-0.35$ and still in short from 0.468$.

Kadena broke downKadena broke the wedge and i think it will run for the 0.3x liquidity. In short since 0.468$.

KDA 1st target achieved (trade #1)we achieved the first target of $KDA.
support my content if you like it by Boost🚀
