KernelDAO Short-Term Trade Setup · 300% Profits PotentialThis is another strong chart setup. I am looking at the short-term because that is the request I am getting from many of my followers. People are interested now in growing their capital so this can be used to accumulate strong reputable projects later on. Something like double-up, triple-up then grow some more. When enough cash is available; sit back, relax and hold.
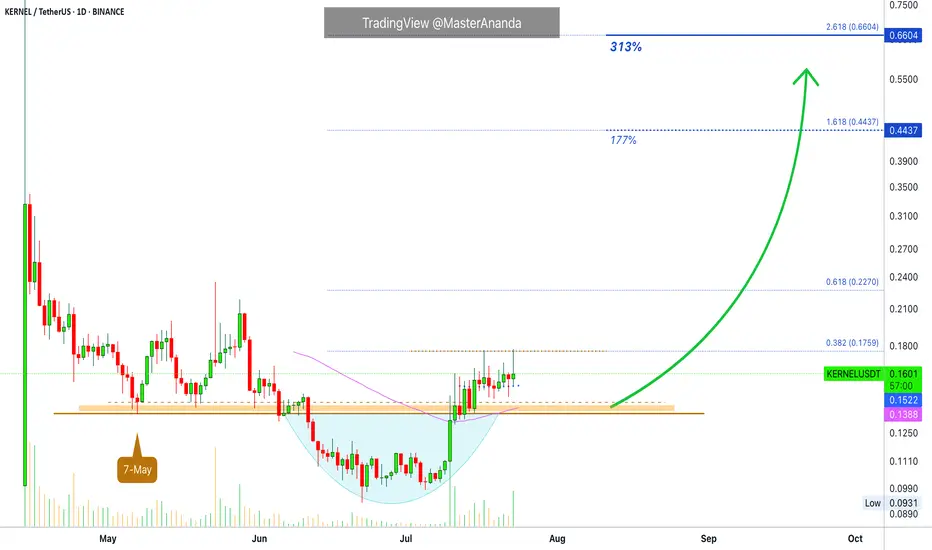
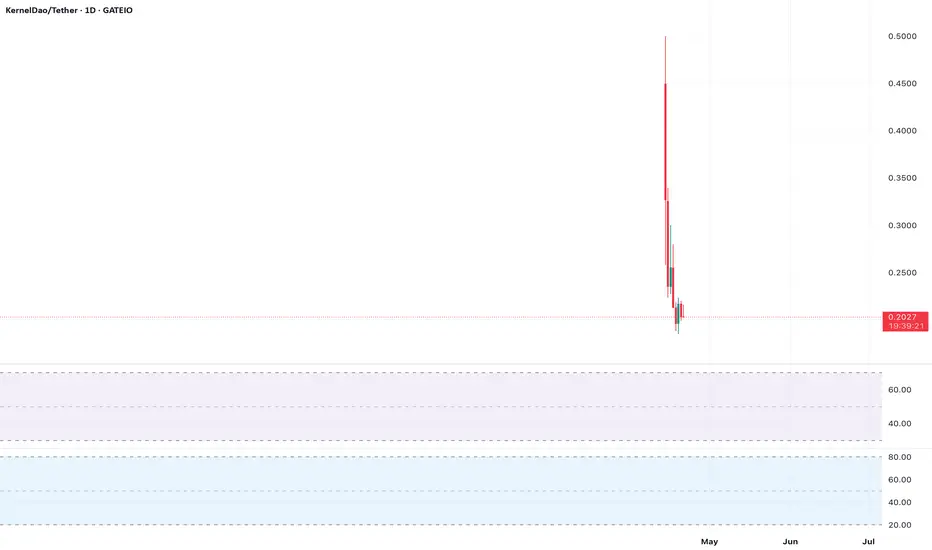
The main low here is 7-May. The break below support is the liquidity-hunt event.
After the action recovers above support, bullish confirmed.
Notice KERNELUSDT trading above EMA55 and EMA89 daily.
Trading volume also favors the bullish side. Notice how red days have very low volume. On green days we have the higher numbers of volume spikes. High volume when buying, low volume when selling.
The first target is good and strong for 177%. The second target goes to 300%. This can be achieved easily within 1 month (short-term), or it can extend to two months but not much longer. The trick is to be ready to wait.
If you expect the market to move within hours or days, you might be disappointed. Yes, sometimes it moves fast but this is the exception and not the norm. Better to be prepared to wait a long time and if it moves faster, that's a bonus but we have to be realistic to produce consistent wins. If you want to be in the action, diversification is a good strategy. If you just want to win, patience is key.
Namaste.
KERNELUSDT trade ideas
KERNEL/USDTKERNEL/USDT is showing strong bullish structure at the current price zone, indicating accumulation and strength from smart money. After a period of consolidation, it's gaining momentum and looks poised to make a parabolic move

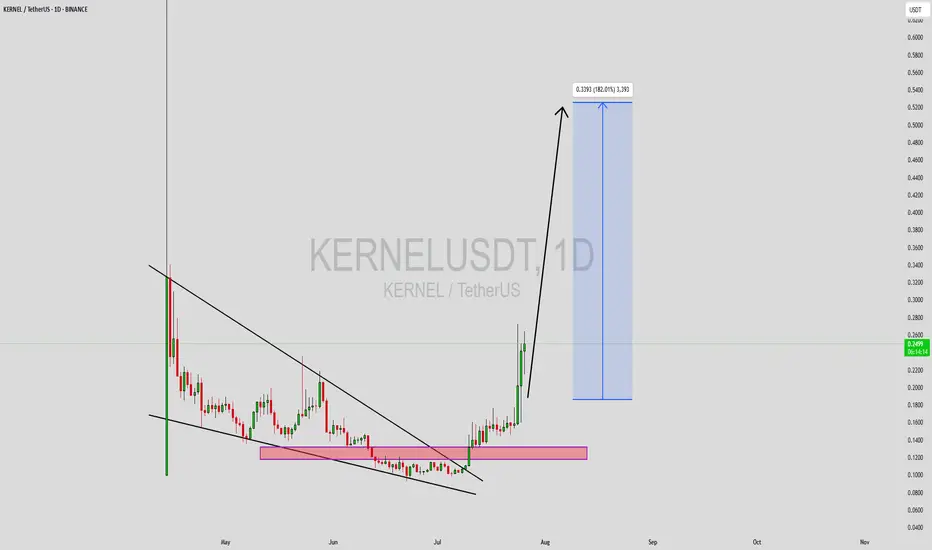
KERNELUSDT Forming Falling WedgeKERNELUSDT has recently completed a significant technical breakout from a well-defined falling wedge pattern, which is known in crypto trading for its strong bullish implications. The asset had been consolidating within this wedge for weeks, forming a base in the demand zone highlighted in the pink region on the chart. Now, after gaining enough strength and momentum, it has broken through resistance with solid bullish candles, signaling the start of a potential parabolic move.
Volume confirmation during the breakout phase is notable—indicating real buying interest rather than a false breakout. Based on this breakout and the current momentum, the expected gain is projected between 170% to 180%+, and the measured move target points toward the $0.33–$0.34 region. KERNELUSDT’s price action has shifted from accumulation to expansion, often the most profitable phase for trend traders. With higher highs and higher lows starting to form, bulls are in clear control.
In addition to the technical pattern, KERNEL appears to be attracting attention from investors, potentially due to its tokenomics, project fundamentals, or upcoming developments. Traders looking for high-reward opportunities with favorable entry points may find this setup ideal, particularly with the recent retest of the breakout zone acting as confirmation. If momentum continues, this rally could easily extend beyond the projected zone.
This is a textbook example of a reversal structure evolving into an explosive breakout. KERNELUSDT is now trending upward strongly, and staying updated on volume surges and any pullbacks to the breakout zone can help traders ride the wave efficiently. The crypto market rewards breakout traders when strong technicals align with market sentiment—and this is one of those moments.
✅ Show your support by hitting the like button and
✅ Leaving a comment below! (What is You opinion about this Coin)
Your feedback and engagement keep me inspired to share more insightful market with you!
KERNELUSDT Poised for Breakout: Double Bottom Signals ReversalDouble bottom pattern forming on BINANCE:KERNELUSDT on daily with bullish follow-through.
Price approaching downtrend resistance — a breakout could trigger a strong upside move.
Targets on breakout:
🟡 Target 1: 0.2066
🟡 Target 2: 0.2384
🟡 Target 3: 0.2734 (+54%)
Watching for daily close above trendline for confirmation.
#KERNELUSDT #CryptoBreakout #ChartPattern #DoubleBottom #AltcoinAnalysis

KERNEL NEAR TERMTo me the view is pretty clear.
* The purpose of my graphic drawings is purely educational.
* What i write here is not an investment advice. Please do your own research before investing in any asset.
* Never take my personal opinions as investment advice, you may lose your money.
$KERNEL Showing Dual-Timeframe Bullish Setup🔥 $KERNEL – Setup in Motion
📉 On the Daily timeframe, $KERNEL is breaking out of a descending triangle — a classic sign that a trend reversal or fresh momentum may be brewing ⚡️
🕓 Meanwhile, on the 4H chart, price is testing a round bottom structure — often a solid base before a potential liftoff 🚀
👁 Dual confirmation across timeframes strengthens the bullish case.
👀 Keep an eye — this setup is gaining traction and could trigger a notable move soon!
WHY WILL IT GO HIGH?Reasons indicating strong potential:
- Large and active community on social media
- High scammer activity
- Trap for inexperienced users: selling on DEX at 3x lower price than on CEX due to low DEX liquidity
Let me know if you'd like it even more formal or formatted for a report.

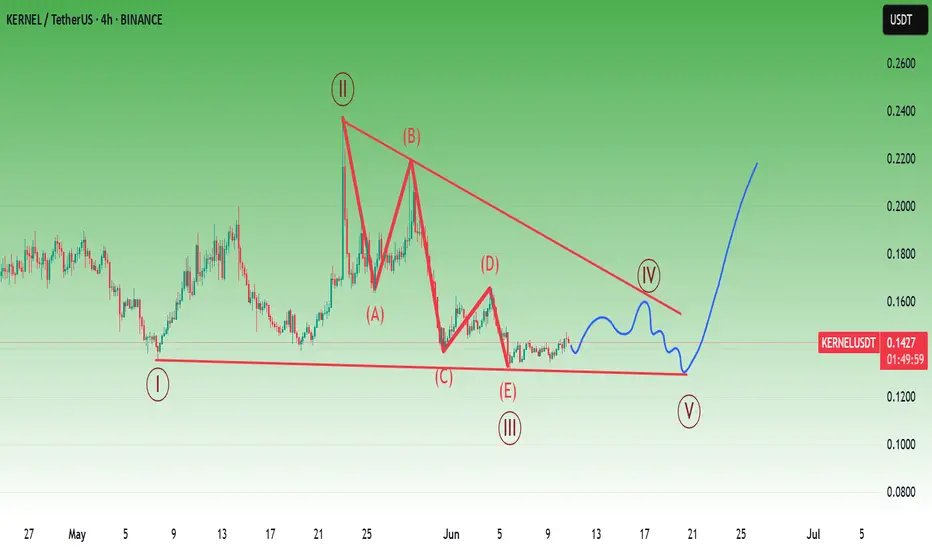
Is going as it shouldEverything is going according to plan. We are just waiting for the moment of a sharp upward leap...

Everything is sold...The project is new and related to restaking. Most sellers who wanted to exit have likely already done so. The project owners clearly aren’t abandoning it — there’s still activity and intent behind the scenes. The chart shows consistent spot accumulation at increasingly higher prices, suggesting it’s not just one individual buying. I recommend considering a spot position for a 1–2 week timeframe.


$KERNEL’s Bearish MACD Crossover$KERNEL’s MACD crossed bearish on April 14, with price at $0.25. Lower highs persist, targeting $0.1844 support. Bulls need $0.30 reclaim. Always use stops

$KERNEL’s Bollinger Bands Signal BreakoutNarrowing Bollinger Bands on $KERNEL’s 1H chart suggest a big move soon. Price at $0.1948 tests $0.20 support. Breakout direction unclear—watch volume! Trade wisely.

$KERNEL’s Volatility Spikes to 35%$KERNEL’s daily range hits 35%, with price at $0.25. Support at $0.2222 under pressure. Use wide stops and watch for a break of $0.30 for bulls. Not financial advice

$KERNEL’s 50 EMA Blocks UpsideThe 50 EMA ($0.28) is capping $KERNEL’s rallies on the 4H chart. Support at $0.20 holds for now. Break above $0.28 needed for bullish momentum. Manage risk

$KERNEL’s Volume Fades on DeclinesDeclining volume on $KERNEL’s recent drop to $0.1948 signals weak selling pressure. RSI near oversold at 30. Watch $0.2222 for a potential reversal. Not a trading signal—DYOR

$KERNEL Faces Resistance at $0.35$KERNEL struggles to break $0.35 resistance, showing lower highs on the daily. Bearish momentum persists with MACD below zero. Support at $0.20 critical. Trade with caution

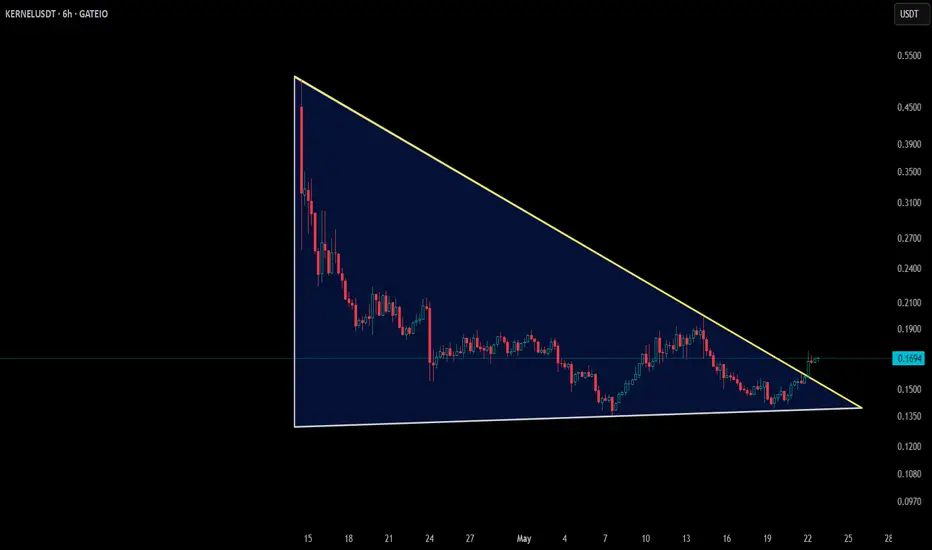
$KERNEL’s Symmetrical Triangle Tightens$KERNEL is consolidating in a symmetrical triangle on the 4H chart, with support at $0.1844. Breakout above $0.22 or below $0.18 imminent. Set tight stops—volatility is 11.09%! DYOR.
$KERNEL Nears Oversold Territory on RSI$KERNEL’s RSI (14) on the 1H chart is at 32, close to oversold. Price is testing $0.20 support. A bounce could target $0.22, but bearish MACD suggests caution. Watch volume for confirmation. Not financial advice

$KERNEL’s Bearish Trend Persists, But Oversold Signals EmergeSince its launch on April 14, $KERNEL has faced intense selling pressure, dropping 55% from its highs to $0.25, with a current market cap of $39.14M. The daily chart reveals a markdown phase with lower highs and lows, supported by rising open interest in shorts. The 50 EMA ($0.28) is acting as dynamic resistance, while the 200 EMA ($0.18) offers potential support. The Bollinger Bands are narrowing, suggesting low volatility and a possible breakout soon. On-chain data shows $1.6B in TVL, dwarfing the market cap, hinting at undervaluation. For a bullish setup, watch for a reclaim of $0.2222 with a spike in volume to confirm reversal momentum. Conversely, a break below $0.20 could see $0.15 as the next target. Use the ATR (currently 11.09%) to set stops and manage risk. This is for educational purposes only—always consult a financial advisor before trading.

$KERNEL Testing Critical Support – Is a Reversal Imminent?$KERNEL is currently trading at $0.1948, down 8.16% in the last 24 hours, and showing signs of consolidation near a key support zone around $0.1844-$0.20. On the 4H chart, the price is forming a symmetrical triangle, with lower highs and higher lows, suggesting indecision. The RSI (14) is hovering near 30, indicating oversold conditions, which could signal a potential bounce if buyers step in. However, the MACD shows bearish momentum with a recent crossover below the signal line, aligning with fading volume on rallies. Key resistance lies at $0.30-$0.35, where previous distribution phases capped upside. For bulls, a break above $0.22 with strong volume could target $0.26. Bears should watch for a breakdown below $0.1844, which may push prices toward $0.15. Always use tight stops in this volatile market and avoid overleveraging. This is not financial advice—DYOR and trade responsibly
