KMDBTC trade ideas


$KMD - LONG - 4HR- Triangle with descending volume looking to break out
- ran stops below support and now coming back over
- could target previous highs but trying to be conservative and lock profits

$KMD Potential bullish flag as continuation of the trend...
UCTS buy signal active on the daily
MACD & RSI flat, deciding (⏳)
Volume looks low for now
While the ascending trendline hodls we can expect further up movements for the asset.
#KMD

SoT 2.0 Chartoff Submission Week 3 KMD/BTCKMD/BTC looks poised for a breakout demonstrated by the following criteria:
-Upward Laddering has started on the 1 hour time frame
-Likely to hold support on a Daily Level from the past
-Daily Trends are coming to an intersecting point on the Daily support level creating a wedge to be broken
I have decided to take entry if a accumulation occurs on the long standing Daily Level from the past. I am waiting to see if this support holds closer to the Daily Down Trend before taking entry to reduce risk then holding for the break of that level. Breakout should occur before March 21st 10:00am. To reduce risk I would potentially use the daily uptrend as a stop if the move goes sideways through Trend which would indicate move failure.


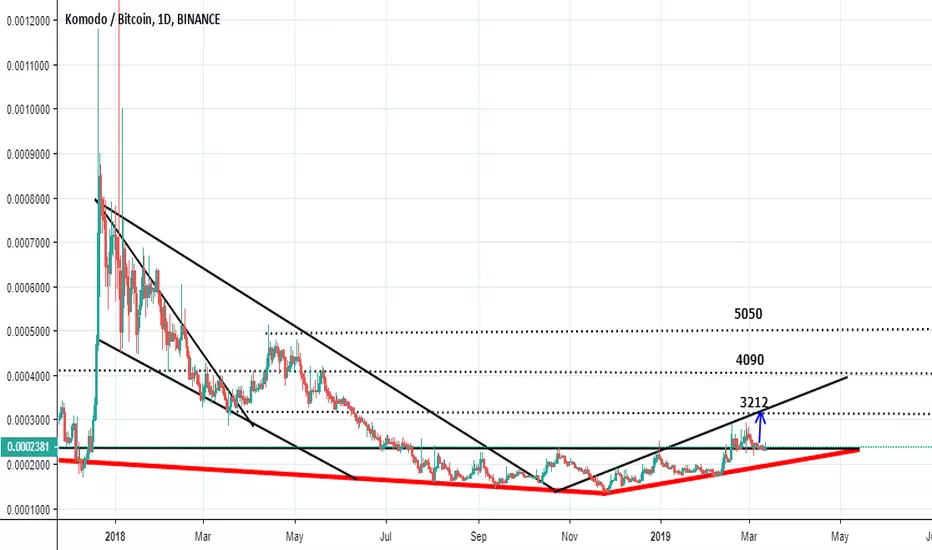
$KMD Showed highest trade volume in Binance history$KMD Showed highest trade volume in Binance history, confirming the switch as resistance-->support of the ~2277sats level.
Currently some retrace (RSI bearish divergence) after the 60%+ Candle can be expected
Entry close to the green box seems a good option for future trades #KMD


KMD could be ready for a breakout! KMD looking ready to pop but looking for a pullback first before entry!
Thanks guys!

KMD longMarkup phase for KMD, healthy accumulation, broke out of trading range and found support. Golden cross. wonderful


Incoming pullback?$KMD 50% run over the last 2 weeks, right now its starting to show signals of an incoming pullback at least to retest gained levels.
Both MACD & RSI showing bearish divergences.
Volume slowly decreasing & a potential ascending wedge could at play.
stay alert... lock profits! #KMD

KMDBTC Looking 1 Week holdKMD 1 Week Hold Buy Range 2350-2390. Targets Open to 3000 Sats Area. Stop Loss 4%. To potentially gain 20+%


KMDBTC a long opportunity aheadThe KMDBTC is likely to have some retracement between 0.618 to 0.786 fibonacci levels to make some harmonic move.
The 200MA is just beneath the buying zone to provide support to bullish divergence insha Allah.
The targets are defined accordingly plz find on chart.
Regards,
Atif Akbar (moon333)

KMD on its way to a double top??Daily timeframe looks good.EMA 200 could act as resistance, thats where i put my first target. But my guess is we will break it and go towards the previous high where we saw some harder resistance.
KMD is getting supported by a bunch of moving averages on multiple timeframes.
Lower timeframe indicators tell me we could go down a bit before making another run. 15 min charts shows we could go down to 1800 range first.
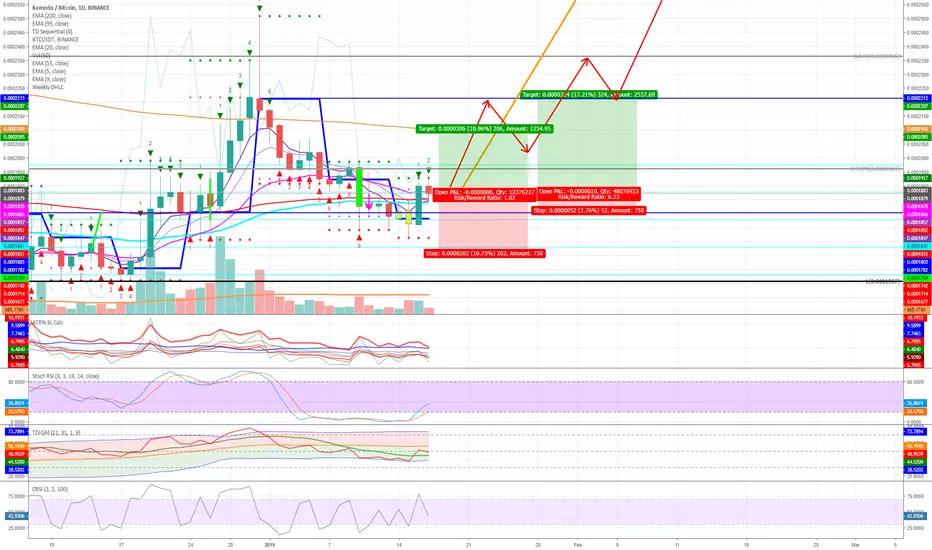
KMD-BTC Long Trade PlanCommodity : KOMODO
Trade Type : LONG
Trading Against : BITCOIN
Entries : Double-UP Entries throughout the Buy Zone
Profit Taking : 25% at each TP point
Profit Locking : Move SL to break even once TP1 is hit, to TP1 once TP2 hits, to TP2 once TP3 hits and so on
Duration - 1 Week
Investment in trade : 10% of the total Trading Balance.
Prospective Profit : 8% to 24%
Prospective Loss : 4%
RRR : SL to TP1 is 1.71, SL to TP2 is 2.92, SL to TP3 is 3.92 and SL to TP4 is 5.05
Buy Zone/TPs/SL price points are marked in the chart as follows
Greens - Profit Targets (TPs)
Blue - Buy Zone (Entries)
Red - Stop Loss (SL)
