KNCBTC trade ideas

Considered picking up some $KNC here3668 sats seems like a good price. Has held that support quite a few times. On Binance, however there is a big whale trying to offload 800k of them at that price. Why would a whale like that be selling that huge amount of coins for so low? Perhaps they know something I don't? I think I'm going to follow the smart money here and wait. ibb.co


KNC/BTC - About to BounceKNC/BTC - is about to bounce from the horizontal and the trend line support.

Daily Bullish Signal $KNC #KNC KNC/BTC (1 Jan)BLUE ARROW indicates the EXPECTED Time and Targets
Level Stoploss point up to maximize profit and reduce risk
I'm working all the time, even in Bearish Market

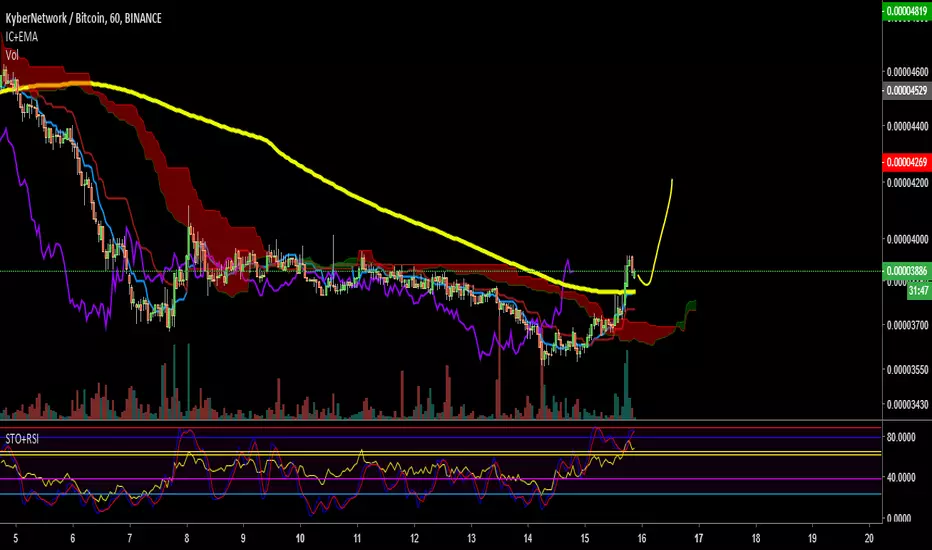
[KNCBTC][60% PP] KyberNetwork Analysis + Trade (1000%+ PP)KyberNetwork (KNCBTC) is looking good on Binance... Come and read the charts with me... Hit LIKE to get started!
KNDBTC Weekly Chart Analysis
We have two inverted hammers supported by big volume. Drops in price become smaller and smaller... KNCBTC hit a new all time low but now it is showing signals that it will soon start to move up... After consolidation of course.
Divergence is building up on the MACD and the RSI is oversold.
We also hit the lower band of the Bollinger Bands and more signals are coming from shorter time frames... KNCBTC is reaching bottom.
The chart above is the daily chart, looking at the RSI, MACD, volume and candlesticks, shows that a bounce can happen and we can profit from with very low risk but high reward.
Here is the trade...
(We need to break and close above EMA10 for the action to start on the daily time frame - you can also trade after breakout...)
KyberNetwork by Alan Masters
Buy in: 0.0000372 – 0.0000392
Targets:
(1) 0.0000430
(2) 0.0000481
(3) 0.0000547
(4) 0.0000600
Stop loss: Close daily candle below 0.0000330.
Capital allocation: <10%.
LEARN TO GO WITH THE FLOW
I am seeing the market, trying to turn from red to green.
We have been slow for long, but that was truly a blessing for me.
As I am used to say, more opportunities will come your way.
So it is wise to enjoy the action, the profits, all the trades...
As well as the peace... Also make sure to enjoy the slow days.
So the market works in cycles, it moves down, it moves up.
The goal is not to force it, but to learn to go with the flow.
Namaste.

KNC Trading AdviceBuy Price: Yellow Line
TP: Green Lines
Moon: White Line
Support: Blue Line
SL: Red Line
Invest Suggestion: 5-10 Percent
Profit Expectations: 5, 10 or >20 Percent
Just hold and watch. All targets will be reached within 24 to 72 hours as my prediction. Moon can take >15 days. But it's recommended to hold it for 6-7 days if any target not reached. Sell when you got some profit. I am sure, you will be get nice profit. Good Luck!
Looks Good? Leave a like, share and tell me in comments if my trading advices are working for you.
Show your love.
Please ask me for any coin address to make a donation. Your donation will encourage me to keep up this service.
Thanks for visiting.

KNC Kyber Network #KNCBTC
Kyber’s on-chain liquidity protocol allows decentralized token swaps to be integrated into any application, enabling value exchange to be performed seamlessly between all parties in the ecosystem.
Buy: 6514-6137
Target:
7030
7353
7907
8569
8877
SL: 5543
Risk / Reward
10% / 45%
Invest: 3%

KNCBTCKNCBTC
open Entry : 0.000061 - 0.000062
sell target : 0.000068
2nd target : 0.000077 - 0.000078 ( strong resist )
3rd target : 0.000085
2nd Entry , just in case : 0.000058

Daily Bullish Signal $KNC #KNC KNC/BTC (07 November)#KNC (KNC/BTC)
Buy : 6000-6200
Stop : 5400
BLUE ARROW indicates EXPECTED Time and Targets
Level up Stoploss point to maximize profit and reduce risk

KNC - Good Prices For 3rd WaveKNC have a nice run with 1st wave and now moving in correction 2nd wave.
We almost reach support levels. And I decide to show you this coin for good entering position price. Thanks for info of this coin to @BilimNehri.
The levels 606-625 is good support, so market can react with spike on this levels.
By the way it seems that correction can go 1 week more. Because now we see big impulse down and sell off and market need to decrease volatility to go long again.
But you can build positions from this levels because we already have big oversold under 1D MA lines and should see some positive action in few days.


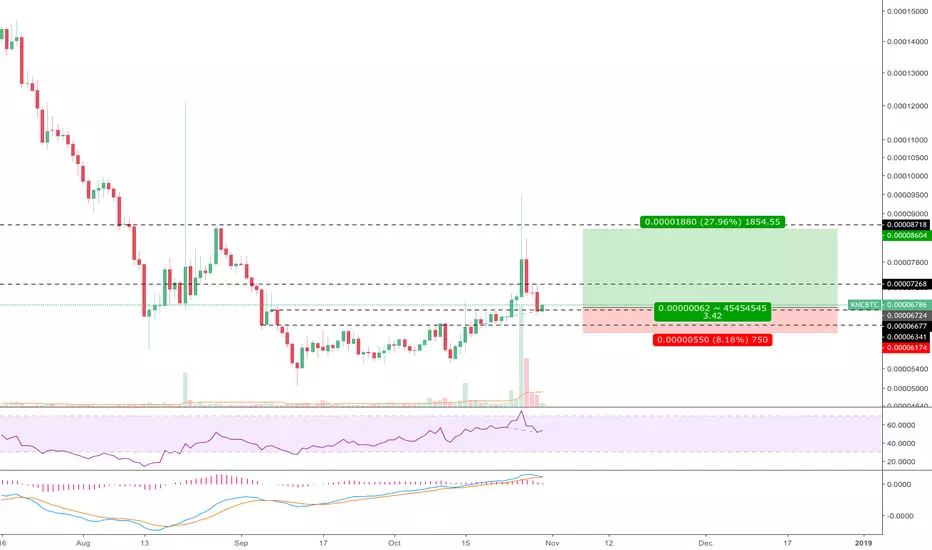
KNC/BTCRisk : High
Coin : KNC/BTC
Exchange: Binance
Entry Zone: Between 0.0000675 to 0.000069
Target 1 : 0.0000740 (9%)
Target 2 : 0.0000788 (16%)
Target 3 : 0.0000860 (26%)
Stop Loss: 0.0000615 (9%)
Comment :
Symetrical rising triangle pattern
RSI uptrend
MACD bullish


RSI divergence KNCI published another RSI divergence on AMB. KNC looks like same for me. Long down trend ended. We can see accumulation in red rectangle. It seems like RSI divergence correction is starting and volume is rising. Let's see.
DYOR

KNC showing signs for trend reversal and runupNice early spikes that start breathing life into a depressed asset

[KNC/BTC] CLEAR BUY SIGNAL ON WEEKLY [ 50-300% PROFIT]#KNC / BTC ( Binance , Bitfinex )
Buy Range : 6350-6500
Stop Loss : Not recommend
Target 1 : 9500
Target 2 : 13500
Target 3 : 17000
After some weeks on an accumulative zone. KNC is showing some clear indicators on the WEEKLY chart which suggest us that's very good time to buy if you aren't holding this coin yet.
- MACD is just crossing giving us a pretty buy signal
- CCI could be turning into green on the next weeks ( green on other short-ranges )
- Stoch RSI confirming upside movement
- RSI break downtrend , touched oversold zone and now going up
For me its clear this coin is going for the upside and it will need time to reach higher zone again, but if you are looking a very good risk/reward, that's the time.
Good luck

$KNC - first step on the way up- Initial break out of lower range, currently looking to long at the Green OB (Daily)
-should see first target hit which is the 4HR OB (25% profit) and will watch price action after that, should wick into 8600 SATS
-Target marked by long calculator is a 65% hit rate and what I would like to see finally hit, T3 is arbitrary.

KNC levels for Tradrz members.KNC
The first time we have seen the 9 and 20 ema above the 200 ema since the April breakout, this could get interesting if supports hold.

There is a possibility for the beginning of an uptrend in KNCBTCTechnical analysis:
. KyberNetwork/Bitcoin is in a range bound and the beginning of uptrend is expected.
. The price is above the 21-Day WEMA which acts as a dynamic support.
. The RSI is at 55.
. The price downtrend in the daily chart is broken, so the probability of the resumption of an uptrend is increased.
Trading suggestion:
. Price is in the support zone (0.000064 to 0.000054), traders can set orders based on Daily-Trading-Opportunities and expect to reach short-term targets.
Beginning of entry zone (0.000064)
Ending of entry zone (0.000054)
Entry signal:
Signal to enter the market occurs when the price comes to " Buy zone " then forms one of the reversal patterns, whether " Bullish Engulfing ", " Hammer " or " Valley " in other words,
NO entry signal when the price comes to the zone BUT after any of the reversal patterns is formed in the zone.
To learn more about " Entry signal " and the special version of our " Price Action " strategy FOLLOW our lessons:
Take Profits:
TP1= @ 0.00008680
TP2= @ 0.00010000
TP3= @ 0.00011750
TP4= @ 0.00013140
TP5= @ 0.00015900
TP6= @ 0.00018700
TP7= @ 0.00020600
TP8= @ 0.00023530
TP9= @ 0.00027380
TP10= @ 0.00033470
TP11= @ 0.00044000
TP12= Free
