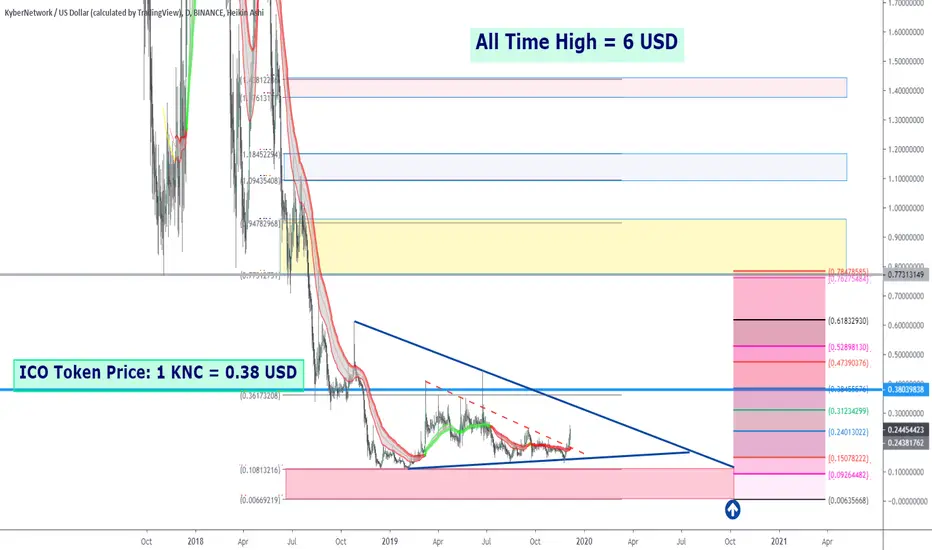
Kyber Network / Fighting for Its Life What to say?
The one of the worst performers !
But If The Price Falls to $007, I'll buy it.
Disclaimer:
We are not registered or licensed in any jurisdiction whatsoever to provide investing advice or anything of an advisory or consultancy nature,
and are therefore are unqualified to give investment recommendations.
Always do your own research and consult with a licensed investment professional before investing.
This communication is never to be used as the basis of making investment decisions, and it is for entertainment purposes only.
KNCUSD trade ideas
The Case for Higher KNC Prices!!Hi Friends!
Although Kyber Network (KNC) will benefit from rapid DeFi adoption, many investors are still pricing it as just a DEX...
Most DEX tokens are trading at or near all-time lows...
For example, AirSwap ( AST ) is down 98.5% and 0x (ZRX) is down 94% from all-time highs...
KNC is down over 90% from its all-time high...
So it's clearly being overlooked by investors...
But I believe Kyber will become a key component of DeFi...
With Binance's upcoming blockade on U.S. traders, the sector will grow dramatically overnight...
And KNC will be an immediate beneficiary...
We should expect KNC prices to double by the end of the year and potentially soar to around $5.42...
That would be a 3,000%+ gain from the buy-up-to price of $0.1775 !!!
Stay ahead of the masses,
Seth Maniscalco
Founder, Crypto Wealth Coach LLC
Owner, Modern Wealth Management LP
www.CryptoWealthCoach.com

KNCUSD a 2340% under valued asset can make a new high upto 2617%On two weeks chart after a long time at last the 25SMA has crossed down the priceline to lift the price up very soon insha Allah.
Therefore I have defined the buying zone between 0.886 to 1.13 fibonacci.
The bearish shark with all required dimensions from X to C legs is formed soon when the 25MA will lift the pirce action up the formation of C to D leg will be started.
It will be a massive move.
The sell targets are:
Secure sell targets: $1.43453275 to $2.83247482
Aggressive sell targets: $6.74000000 to $5.45500000
Regards,
Atif Akbar (moon333)

KNCUSD a buying opportunityThe price action is entered in potential reversal zone and ready to hit the targets at any time insha Allah.
The targets are:
Buy between: 0.23147639 to 0.17942371
Sell between: 0.27251807 to 0.39515152
Regards,
Atif Akbar (moon333)

KNCUSD - MORE PROFIT FROM CGBuy Price: Green Zone
SL: Below Red Zone
Profit: Blue Zones
Invest Suggestion: 50 Percent
Profit Expectations: 400 Percent
All technicall indicators of KNC are turning good( like my call of OAX), soon the EMA 13 will cross the others EMA's. Volume is good to make a break out too!
Besides, we have great news about crypto comming( search them on google , i can't post links here )!
The key levels for this trade are the yellow circles and the arrows, keep watching it, when KNC hit that zone, it can retrace!
See me previous analysis and how profitable the are!
Sell when you get some profit, according the way you trade.
Keep following us and please like this idea.
Any doubts? Send in the comments or in our telegram or Inbox here.
Thanks for visiting.

Kyber Network’s (KNC) Price Jumps Over 50% in Saturday BreakoutKyber Network (KNC), a decentralized exchange protocol, surged over 50% on Saturday to $0.40, a price last seen in November. The breakout comes on the back of more than a month of gains following the release of the project’s 2019 roadmap at the end of January.

KNCUSD Some more upside leftTarget: 0.47000 (+320% rise based on the previous similar bullish sequence).

Kyber Network (KNC) Confirming breakout! (HIGH RISK) Always do your own research! before investing.
Kyber Network’s on-chain liquidity protocol allows decentralized token swaps to be integrated into any application, enabling value exchange to be performed seamlessly between all parties in the ecosystem. Tapping on the protocol, developers can build payment flows and financial apps, including instant token swap services, erc20 payments, and innovative financial dapps - helping to build a world where any token is usable anywhere.
Market Cap
$45.944.034 USD
Circulating Supply
157.190.162 KNC
Total Supply
215.141.711 KNC


A trading opportunity to buy in KNCUSDTechnical analysis:
. KYBERNETWORK/DOLLAR is in a range bound and the beginning of uptrend is expected.
. The price is below the 21-Day WEMA which acts as a dynamic resistance.
. The RSI is at 57.
. The RSI downtrend & The price downtrend in the daily chart are broken, so the probability of the beginning of uptrend is increased.
Trading suggestion:
. We have already opened 8 BUY trade(s) @ 0.96826459 based on 'a reversal candle (Valley)' entry method at 07.16.2018 in our suggested support zone (0.9608 to 0.7076).
Beginning of entry zone (0.9608)
Ending of entry zone (0.7076)
Entry signal:
Signal to enter the market occurs when the price comes to "Buy zone" then forms one of the reversal patterns, whether "Bullish Engulfing" , "Hammer" or "Valley" in other words,
NO entry signal when the price comes to the zone BUT after any of reversal patterns is formed in the zone.
To learn more about "Entry signal" and the special version of our "Price Action" strategy FOLLOW our lessons:
Take Profits:
TP1= @ 1.1608
TP2= @ 1.4954
TP3= @ 1.8088
TP4= @ 2.4892
TP5= @ 3.0399
TP6= @ 3.5879
TP7= @ 5.3674
TP8= Free

Kyber Network would probably resume its uptrend againTechnical analysis:
. KYBERNETWORK/DOLLAR is in a downtrend and resumption of uptrend is expected.
. The price is below the 21-Day WEMA which acts as a dynamic resistance.
. The RSI is at 32.
Trading suggestion:
There is a possibility of temporary retracement to suggested support zone (1.4325 to 0.7844). if so, traders can set orders based on Daily-Trading-Opportunities and expect to reach short-term targets.
. Beginning of entry zone (1.4325)
. Ending of entry zone (0.7844)
Entry signal:
Signal to enter the market occurs when the price comes to "Buy zone" then forms one of the reversal patterns, whether "Bullish Engulfing" , "Hammer" or "Valley" , in other words,
NO entry signal when the price comes to the zone BUT after any of reversal patterns is formed in the zone.
To learn more about "Entry signal" and the special version of our "Price Action" strategy FOLLOW our lessons:
Take Profits:
TP1= @ 1.9035
TP2= @ 2.3837
TP3= @ 3.0162
TP4= @ 4.1617
TP5= @ 5.3674
TP6= Free

KNC Cup and Handle formation. Long term 4x opportunityKNC completed its wave 1 &2.
Wave 3 is about to start.

KNC USD Long.. KYBER BULLKyber(KNC) has been COnsolidating for a while now..
REcently KNC was added to some exchange which caused the PUmp...
we have some confirmations from 50 EMA + a symmetric triangle is in play
targets are based on FIB extension levels 1.27 to 1.414 which can be changed in future depends on market condition
GOod Luck

Kyber Network At Least x3 PotentialKyber Network has found the bottom at $0.8, after which it broke above the downtrend trendline and went back down to $0.8 support area, where the double bottom seem to be formed.
Each time KNC/USD approached the $0.8 area it formed a bullish divergence on the RSI oscillator suggesting the trend reversal. Now it looks like a very attractive price as well as I timely entry point to go long on Kyber Network. The first strong resistance is seen at 50% Fibonacci retracement, that is $3.2. If/when target is reached, Kyber would triple in value and this could be just the first wave up.
Break and close below $0.8 would extend the consolidation and could present even better buying opportunity in the short and long term.

KNC testing bottomWould like to see a bounce off the bottom. Would cut losses before a dip under $.70, don't have the perfect exit outlined as we will need to follow price for a reversal. Looking for KNC to set higher highs and higher lows.
