KNCUSD trade ideas


KNCUSDTknc usdt
bearish funnel pattern around the lows so might see some releif from this zone
rsi bullish divergence hasnt played out yet
obv broken out and trying to reversal trend
see how we go
its down massively so migth take a while for new trend to start
also might be on the cusp of a total market selloff here so be careful and stops as always

KNC Reversal UpdateA new reversal pattern has come to reinforce the previous signal of a possible reversal.
All the last 5 candlesticks have long tails. That a sign of a local supply zone.
Price may go as low as 45% or more before find the next important support at $2.30.
Any thing can happen in the crypto market, be careful with your shorts.
You can find my previous KNC TA below.
Investing is a probability game.
Try for consistency, there is no perfection in this.
Not financial advice. Always do your own research.

KNC Reversal Update & General InfoAs I said in my previous two TAs KNC showed strong signs of a bearish reversal. One more sign has added; this of the fakeout.
“In this report I will explain some crucial issues, most novice traders ignore and lose money and time. “
Fakeout is one of the most dangerous bullish or bearish signs and if you are unable to deal with them you can lose a significant percentage of your investment. It's a complicated signal, i will explain it further in a new report.
Divergences (like volume, ROC, RSI) are NOT timing indicators. This means, f.e., if you find out a ROC bearish divergence in monthly charts, price may raise even for years before the reversal occurred. Use them only in conjunction with other indicator, news, fundamentals etc.
Also like ANY other signals like MACD cross overs; it is not 100%. Why? Because trading is probabilities.
In our example why volume divergence and local supply at $4.40 was strong bearish signs?
1) KNC price was rising while altcoins are in bear market since May 2021
2) EVERY altcoin is HIGHLY correlated to BTC and the MOST important of all… KNC is not the exception.
3) Entire market is in fear & uncertainty for over half a year
Those are only a few of all that can affect the price of a crypto asset.
Crypto market is a live entity. It changes over time.
I am completely out of KNC, at an average of $4.91 per KNC.
What if KNC go straight to $30 from here and you are out of the market, like me. It’s simple…. Don’t care. I will reenter the market when and if price reach at least $2.00 or below $1.00 and/or I find bullish signs in fundamentals & technicals at the same time.
Another personal example:
I bought BTC after Covid Crash at $5k and sold them all at $11.5k. (Find the correlations between and Alts.) With that money I bought MANA, SAND, QTUM, IOTA…Do your calculations. 3500% is bigger than 500%.
I did/will do the same with the profits of the KNC. It was the perfect opportunity to sell.
*Think about it … A crypto rallied 400% while the others went to Hell. The perfect opportunity! *
Do not…never ever be a fanboy of any coin, it’s just … money, nothing more. Sold them when the time comes and find a new opportunity with more potential.
Remember trading/investing is probabilities. Find the way to make money even when you are wrong. Always have an entry and exit plan and DO NOT hesitate never to close a position when going against your expectations.
Thanks for reading!
Follow for more reports and press the like button if you appreciate this.
Not a financial advice. Always do your own research.

Potential One-to-One projection drop on KNC. Short to ~$3.00KNC has had a steady bullish trend from late February to April 28th where it began it's decline below the trend. Max height above the trend line appeared from Marth 8th - March 10th. A one-to-one projection of the distance that price has moved farthest from the trend line from the break out would allow price to bottom out very close to the target falling to an area previously acting as resistance.

KNC trade set upKNC is a coin I’ll be keeping a close eye on this week and see how price reacts to the above resistance zones and possibly short the bounce on invalidation/rejection. Market structure has been broken to the downside hence looking for shorts atm.
NFA DYOR

KNC trade set up. Hey guys hope your all well!
This is a trade set up I’ll be looking for this week. Broke market structure to the downside so look to short the bounces. These are to 2 levels I’ll be keeping an eye on and how price reacts to them.
Safe trading everyone.
NFA DYOR

KNC swings beautifully! What a beautiful chart to watch KNC pull these massive projected patterns over time. Having the patience to sit in these long trades is another story.
I originally thought this climb would stop at the 1.272 extension. But maybe we have room for a 1.618 past the ATH wick after this retrace. Time will tell.
I enjoy long range projecting for fun. I recently decided I would start publishing my ideas on Trading View. Although this idea has partly played out, Id like to start keeping my self more accountable!
KNCUSDPrice broke and retested the fractal order block. The Kumo cloud flipped red and there is a tk cross which are strong signs of bearish momentum

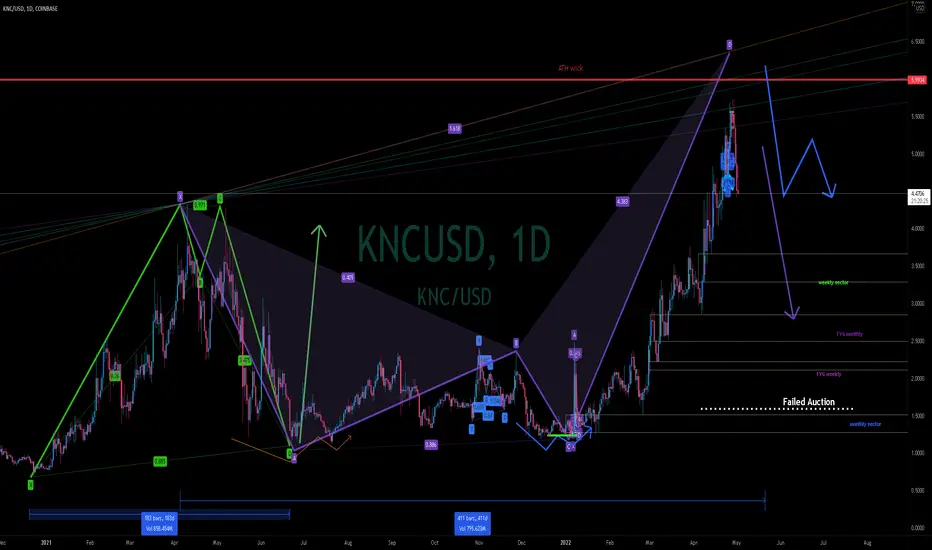
Rough idea of how $KNC plays outThinking there's going to be a big push on KNC for $6 but a dip to let enough longs pile in. Then send it like it's about to double ath, sumn sumn, 'price discovery', but instead just eclipse it and slam it back down to punish any late longers.
We shall continue to observe pa and may be building a long around ~5.05-4.90, sell ~$6 depending on the move, but look for TP there and possibly flip short. Weekly is at ATH on every major indicator as being overbought there has to be few left curvers around to long this more here.

KNCUSDWhy I think that KNC could go up at least 10 times.
I've never seen anything like it before.
Very good looking coin. Very bullish.
It does not mean that price could not go to 3 usd again. It could be very probably.
It is just my opinion, not financial advice.
Please dont follow me, I am just human being.
I like market, I like coins.
Good luck everyone!!!

KNCUSDIt looks like triangle ascending.
We will see it.
If price drop below 5usd, the ascending triangle is canceled.
Good luck everyone!!!

knc short25.04
weekly very overbought.
3d bear div on the rsi since the 13 april.
4h showing slow down and losing strength.
closing position would be when the slow down is just distribution.
opening a short with small position due to high sl and the above mentioned.

KNC on a newer high is good for another move up to ATHi am locking forward to buy some altcoins, KNC looks promissing
What are your toughts? Are there better coins to buy?

KNC/USDNot a bad idea to take some profits here
1. RSI - overextended
2. StochRSI - overextended
3. Plan your taking profits zones before and respect the strategy
4. Don't sell everything, the price can perform better.
5. Keep an eye on macro trends in the markets.
What do you think?

KNC Volume DivergenceKNC is in an uptrend since January while almost all other crypto are in a bear trend.
Last 3 days is struggling to break its previous high at $4.25.
That's what i'm concerned is the volume. It is declining both it the daily and weekly while price is continue to raise.
A rejection is expected in this resistance $4.25 or around 161.8% Fibonacci extension.
If you intend to go long it's not a good idea to open your positions now; it's better to wait a clean break and flip of $4.25 before make your actions.
If this level doesn't break, the retracement may be as low as 50% or 38.2% Fibonacci levels.
Investing is a probability game.
Try for consistency, there is no perfection in this.
Not financial advice. Always do your own research.

Bearish on $KNC for a resonable $3.01/3.02Bearish on $KNC for a resonable $3.01/3.02
- Leledec exhaustion seen
- SL at end of leledec exhaustion

KNC at PCZ of Bearish Bat Showing RSI and MACD WeaknessPrice Action seems to be Rejecting the PCZ of a Bearish Bat on the Daily with Bearish Divergence on Both the MACD and RSI that could lead to a Moderate Retrace before seeing Higher Prices

Kyber Network Legacy Crystal - [Lifetime Triangle] STLFRPThis triangle pattern which has a hidden gigantic cup & handle inside of it has been developing since the infamous 2017 Alt Coin Rally.
$KNC is the most honest brand in cryptocurrency today.
2021 Included mentions via St Luis Federal Reserve + Hand selected as a top tier leader in the Defi space by 3 Arrows Capital.
This is what transparency looks like.
* Price target shown pending possible breakout to the upside.

KNC, the support level stopped falling.The following are machine translations:
The support point keeps rising.
Rising highs are getting higher and higher.
Currently reaching a support point near 3.
Do more in operation, break 3 stop loss, near short-term target 4.

KNCUSD approaching its All Time HighKyber Network (KNCUSD) has been trading within a Channel Up since the January 06 low, supported by the 1D MA50 (blue trend-line). Since April 08, it has been struggling to break emphatically above the 4.4000 Resistance. That was the level where April 10 and May 07 2021 made a Double Top and rejected the price back to the 1.1000 Support.
The current Channel Up seems to be quite similar (so far) to the one that led to the April/ May 2021 Double Top rejection. Its invalidation level then was on the last Higher Low of the Channel Up. On the current pattern, that level is around 2.8000. A break below it, would most likely start a correction towards the Support Zone. As long as the price is above the invalidation line, we are most likely to test the 6.1000 All Time High of January 2018. A weekly closing above it will then target 9.0000 (1.5 Fibonacci extension).
--------------------------------------------------------------------------------------------------------
** Please support this idea with your likes and comments, it is the best way to keep it relevant and support me. **
--------------------------------------------------------------------------------------------------------

