KNCUSDTPERPThe price is on strong support
If this support is lamb there is a high probability of loss and there is a large reward for the sale transaction
KNCUSDT.P trade ideas

KNCUSDTPERP SHORTThe price in the 4-hour time frame forms a pattern of head and shoulders, and due to the momentum of the fall in bitcoin, the probability of this currency falling is higher.

Kyber NetworkKNC/USDT and this coin is now on triangle Pattern and im taking LONG position into my TP 1 after we take TP 1 you move SL to entry

KNC going to zero-ishI think KNC is going to zero-ish :)
FA & PA are bearish
The setup is descent with clear rejection & invalidation close enough. R/R is great
TP are :
1,3
0,1 (x'D)

KNC LongIm not 100% on my stop loss position on this one. Open to criticism. I'd like to be at the stage of the price action sitting above the cloud, but it isn't quite there yet, tbh, this might be the first up more of an a nice rally.
It seems to be shaping up well here. KNC/BTC looking the same setup.

KNC / USDT✅We are providing an analysis with the specific period of time. Pay attention to the expiration date.
📌Stay faithful to the Stop-Limit at all times.
👍(If you find this post useful, give it a thumbs up, share your thoughts in the comments, and feel free to spread the word)

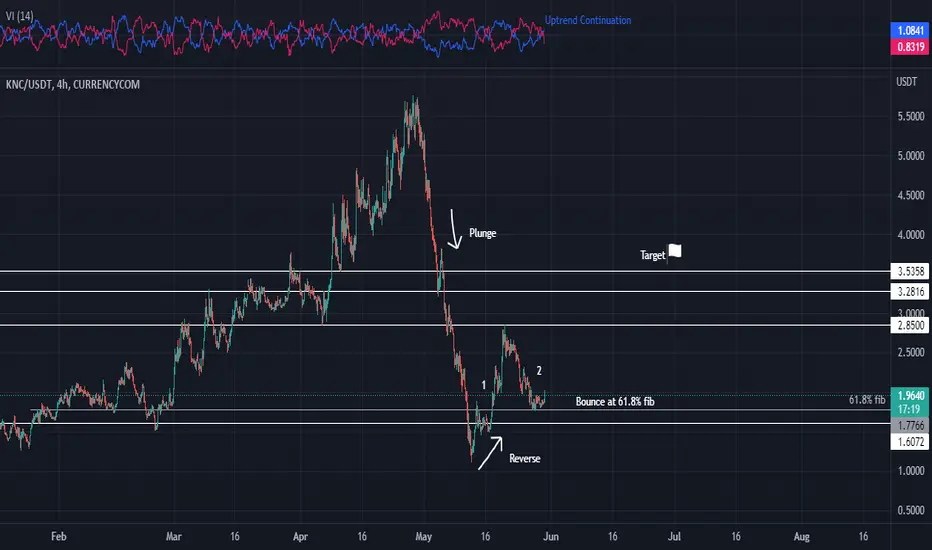
KNC BullishBullish on KNC.
after a massive selloff at approx. $5.75, KNC begin to reverse the trend here.
Trade safely.
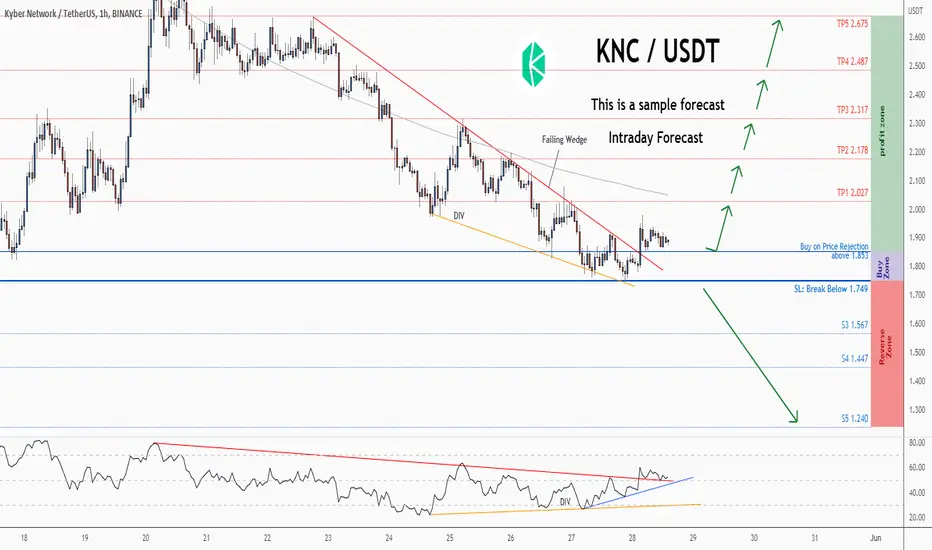
💡Don't miss the great buy opportunity in KNCUSD @KyberNetworkTrading suggestion:
". There is a possibility of temporary retracement to the suggested support line (1.853).
. if so, traders can set orders based on Price Action and expect to reach short-term targets."
Technical analysis:
. KNCUSDT is in a range bound, and the beginning of an uptrend is expected.
. The price is below the 21-Day WEMA, which acts as a dynamic resistance.
. The RSI is at 52.
Take Profits:
TP1= @ 2.027
TP2= @ 2.178
TP3= @ 2.317
TP4= @ 2.487
TP5= @ 2.675
SL= Break below S2
❤️ If you find this helpful and want more FREE forecasts in TradingView
. . . . . Please show your support back,
. . . . . . . . Hit the 👍 LIKE button,
. . . . . . . . . . Drop some feedback below in the comment!
❤️ Your support is very much 🙏 appreciated!❤️
💎 Want us to help you become a better Forex / Crypto trader?
Now, It's your turn!
Be sure to leave a comment; let us know how you see this opportunity and forecast.
Trade well, ❤️
ForecastCity English Support Team ❤️
💡Don't miss the great buy opportunity in KNCUSD @KyberNetworkTrading suggestion:
". There is a possibility of temporary retracement to the suggested support line (1.853).
. if so, traders can set orders based on Price Action and expect to reach short-term targets."
Technical analysis:
. KNCUSDT is in a range bound, and the beginning of an uptrend is expected.
. The price is below the 21-Day WEMA, which acts as a dynamic resistance.
. The RSI is at 51.
Take Profits:
TP1= @ 2.027
TP2= @ 2.178
TP3= @ 2.317
TP4= @ 2.487
TP5= @ 2.675
SL= Break below S2
❤️ If you find this helpful and want more FREE forecasts in TradingView
. . . . . Please show your support back,
. . . . . . . . Hit the 👍 LIKE button,
. . . . . . . . . . Drop some feedback below in the comment!
❤️ Your support is very much 🙏 appreciated! ❤️
💎 Want us to help you become a better Forex / Crypto trader ?
Now, It's your turn !
Be sure to leave a comment; let us know how you see this opportunity and forecast.
Trade well, ❤️
ForecastCity English Support Team ❤️

Undiluted price actionPrice is one percent away from our previous enter and just started dropped...this second entry is good for rentry.


KNC - 31.05.2022 Tuesday - possible range distribution -Long-term Perspective:
price is moving is rebalancing between two daily FVGs creating a range which why i have too look on lower time frame for a clean draw on liquidity bias.
Intermediate-term Perspective:
BSL is taken into a daily FVG + msb + leaving inefficient price action to the downside.
I look for a lower high to play a possible downside trade.


#KNC/USDT 1HOUR UPDATE !!Hello dear traders, we are new here so we ask you to support your ideas with your LIKE and COMMENT, feel free to ask any questions in the comments, and we will try to answer for all, thanks, Friends.
I have tried my best to get the best possible results in this chart.
Hello, dear traders welcome to this KNC/USDT 1Hour chart analysis.
#KNC/USDT LONG TRADE SETUP
ENTRY:-$1.840,$1.900
TARGET:-35%
STOPLOSS:-$1.760
LEVERAGE:-10X TO. 20X
As we can see from the above-mentioned chart that KNC/USDT is currently trading inside the falling expanding channel pattern which is a bullish pattern.
Here KNC needs to break above the upper trend line resistance to get Ito the bullish mode.
We can see KNC pumping upward towards the price level of $2,50 in the upcoming days.
Remember:-This is not a piece of financial advice. All investment made by me is at my own risk and I am held responsible for my own profit and losses. So, do your own research before investing in this trade.
Happy trading.
Sorry for my English it is not my native language.
Do hit the like button if you like it and share your charts in the comments section.
Thank you.

KNCUSDT 1h.
Log in to the specified support
Exit to the first target and if the red area breaks, enter on the pullback
#kncusdt
long att 1.86
tp1 1.93
tp2 1.99
tp3 2.09
tp4 2.17
tp5 2.57
sl 1.82

KNC Failed on Key Level and Requires a confirmation hereKNC Failed on the key level and now requires a confirmation for a possible breakout on the trend line or a reversal for another wave downside. If the price respects the following trend line then we will see a further decline towards the target pointed on the chart.


KNC LONG IDEAAfter a successful short I want to go long here up to the -AOI. To counteract another drop, the entries are placed lower than usual. If the orders are not filled, then it doesn't matter. Am in 3 long positions overall when it comes to Crypto. If the price reaches the upper -AOI before my order is picked up, then the trades will be cancelled.

Descending Triangle with Minor Support and Long Term DowntrendJust an idea labelling my view and what I see, I tried to keep it unbiased as possible. I identified some local, minor, major, long term trend lines & support & resistance zones.
From those lines drawn up I noticed a descending triangle forming with the LTDT and the Major Support, also, the RSI has equalized from the most recent pullback, and has room for further downwards pressure. The price also broke down from the 50 EMA and was rejected after a retest, I believe this is a bearish signal. BINANCE:KNCUSDT

KNC price predictionIt's quite delicate to trade these days when BTC has been ranging between $28600 - $30800.
However, there are some coins with good volatility and with clearer trend: KNC is among these coins.
In 6H time-frame, KNC is forming an ascending triangle with a hidden bullish divergence.
This week, it would reach $2.77. At this resistance level, it's very likely that KNC would be rejected and be thrown back to $2.4 or even lower, to the lower trendline, eventually.

Long on knc structure confirmatoonaBos, tapped in demand and choched, came down as a retrace to fill in some imbalance and we long the imbalance

TS ❕ KNCUSD: ascending channelKNC broke through the ascending channel and reached the support level. The price has already bounced up from the level and now it is possible to return back to the channel.
BUY scenario: long to 2.7.
----------------------------------------------------------------------------
Remember, there is no place for luck in trading - only strategy!
Thanks for the likes and comments.
