KNCUSDT INVEST From Now1-Apply your own risk management.
2-Daily and Weekly Targets
3-Hunt the profits at any level you see convenient for you.
4-Raise Often Your SL to protect your profits.
5-Use 15 % Spot
6-Long it With 5 % LEV5
TSXV:KNC is Excelleny.
KNCUSDT.P trade ideas

KNC BULLS TO TAKE OVERHello Traders and everyone, I am Hadi Karaali, Known as SNIPERS_FX
If you like the idea, do not forget to support with a like and follow.
KNC, BULLS TO TAKE OVER!
As we can see price is still overall bullish trading inside this channel,
However, price broke above our resistance zone and now we are retesting it again, where we will be looking for new longs as it's acting as a support.
Meanwhile, for the bulls to take over, we need a break above the marked major high, then a movement higher would be expected.
If you like this kind of analysis don't forget to like and follow
and as usual follow your trading plan and manage your risk.
Be patient and good luck!

🚨 Trade Alert: KNC/USDT (3-5x)🚨 New Trade Alert 🚨
✅ KNC/USDT (3-5x)
📉 LONG Entry Zone: 0.704 - 0.746
⛔️ SL: 0.6811
🔒 Breakeven Move: When it moves close to TP2
🎯 Take Profit:
Short Term: 0.754 - 0.77 - 0.79 - 0.81 - 0.83
Mid Term: 0.85 - 0.87 - 0.89 - 0.91 - 0.93
📝 Ensure you set entry orders to balance the trade's entry and aim to secure 30% of profits within the first two targets. Once profits are gained, adjust the stop orders to match the entry points or break-even levels.
⚠️ Disclaimer: Historical earnings cannot assure future outcomes. Is there a potential for risk? Certainly. The entire financial market is susceptible to uncertainties; any underlying factor or abrupt shift in market sentiment could overturn the current market trends and lead to losses. Refrain from undertaking undue risks that might jeopardize your financial stability. You are under no obligation to engage in this trade; kindly avoid the trade if you disagree with the trade analysis.
GIS TRADING®

Long trade setup for KNCUSDTFor the BINANCE:KNCUSDT.P Long Trade Setup, the following values are suitable for our interval trade:
Entry: 0.7427
Target: 0.8082
Stop: 0.6948
Cost Reduction: 0.7213
The profit is reasonable relative to the risk.
*This is not investment advice; you can lose money. Crypto AI Signals is not responsible for any trades. 🚫💰

KNCUSDT - BULLISH KNCUSDT is exhibiting a promising technical setup for a potential bullish trade. As of the current price, buying KNC at $0.0780 with a stop loss (SL) at $0.0700 and a take profit (TP) target at $0.0860 could be considered.
The rationale for this trade is based on a bullish perspective. It's worth noting that the market had been range-bound for some time. However, recent price action has shown higher highs (HH) and higher lows (HL), which are typical indications of an upward trend. This suggests that buyers are gaining momentum, and the market might be shifting from a consolidation phase to a breakout and upward movement.
The breakout from the previous trading range indicates that KNC may have more room to move upward. Keep in mind that trading cryptocurrencies involve risks, and it's essential to manage your risk effectively by using stop-loss orders and taking profits as planned. Additionally, market conditions can change rapidly, so stay informed and adjust your trading strategy accordingly

KNCActive has shown a significant decrease, reaching a strong support level at $0.4946, which has been unsuccessfully tested multiple times. Subsequently, a 'Triple Bottom' pattern has formed on the chart, indicati

KNCUSDT's Position in the Demand ZoneKNCUSDT's Breakthrough Bullish Momentum
In the landscape of KNCUSDT, a remarkable development takes center stage as it confidently slices through the downtrend trendline. This resolute move sends powerful signals to market participants, underlining a compelling narrative.
Positioned at the Demand Zone
Further strengthening its case, the asset currently finds its footing at a demand zone, a pivotal area of interest for the bullish forces. This convergence of factors sets the stage for intriguing possibilities.
50% Growth Potential
Analyzing the patterns and the previous upward momentum, we unearth the potential for an impressive 50% growth surge. This projection could propel KNCUSDT to new heights, offering a tantalizing opportunity for investors and traders alike.
P.S. Trade setups and updates are always posted in our channel

KNC NEW VOLUME FOR BREAKThank you for reading our update. Please keep in mind that this is not trading advice.
KNC seems to build new unexpected volume

Volume profile range : 0.82-0.879Hello?
Hello traders!
If you "Follow" us, you can always get new information quickly.
Please also click “Boost”.
Have a good day.
-------------------------------------
(KNCUSDT chart)
The key is whether the price can be maintained by rising above 0.82.
(1D chart)
To do so, the key is whether it can receive support and rise around 0.760.
Since the volume profile section is formed in the 0.82-0.879 section, it is expected that a rapid movement will occur only when it rises above this section.
If it falls, you need to check if it is supported around 0.666-0.702.
--------------------------------------------------
- The big picture
The full-fledged upward trend is expected to begin when the price rises above 29K.
This is the section expected to be touched in the next bull market, 81K-95K.
-------------------------------------------------- -------------------------------------------
** All explanations are for reference only and do not guarantee profit or loss in investment.
** Trading volume is displayed as a candle body based on 10EMA.
How to display (in order from darkest to darkest)
More than 3 times the trading volume of 10EMA > 2.5 times > 2.0 times > 1.25 times > Trading volume below 10EMA
** Even if you know other people’s know-how, it takes a considerable amount of time to make it your own.
** This chart was created using my know-how.
---------------------------------

KNC/USDT Need to Break key area and Back to support area ??💎 KNC has undeniably garnered our interest, showing potential for an upward surge aimed at overcoming a formidable resistance zone. Currently, KNC is navigating a phase of consolidation, oscillating between support and resistance levels. A successful breach of the significant resistance barrier would be the probabilities are on the side of the bull.
💎 However, failure to shatter this resistance could compel KNC to retreat towards the proximate support level at $0.655, necessitating a resurgence of momentum. Should this scenario unfold, it's imperative for KNC to rally from this support, reattempting an ascent to breach the staunch resistance. Historical trends underscore the robustness of this support zone, which has repeatedly bolstered KNC, preventing further declines.
💎 This juncture is critical for KNC, demanding a rebound to initiate an upward trajectory capable of breaking through the tough resistance. A failure to do so could spell trouble, potentially leading to the breach of the vital support zone. Should KNC falter at this stage, the likelihood increases for a continued descent towards a crucial support threshold, marking a bearish turn for the asset.

Long trade setup for KNCUSDTFor the BINANCE:KNCUSDT.P Long Trade Setup, the following values are suitable for our interval trade:
Entry: 0.7213
Target: 0.7696
Stop: 0.6955
Cost Reduction: -
The profit is reasonable relative to the risk.
*This is not investment advice; you can lose money. Crypto AI Signals is not responsible for any trades. 🚫💰

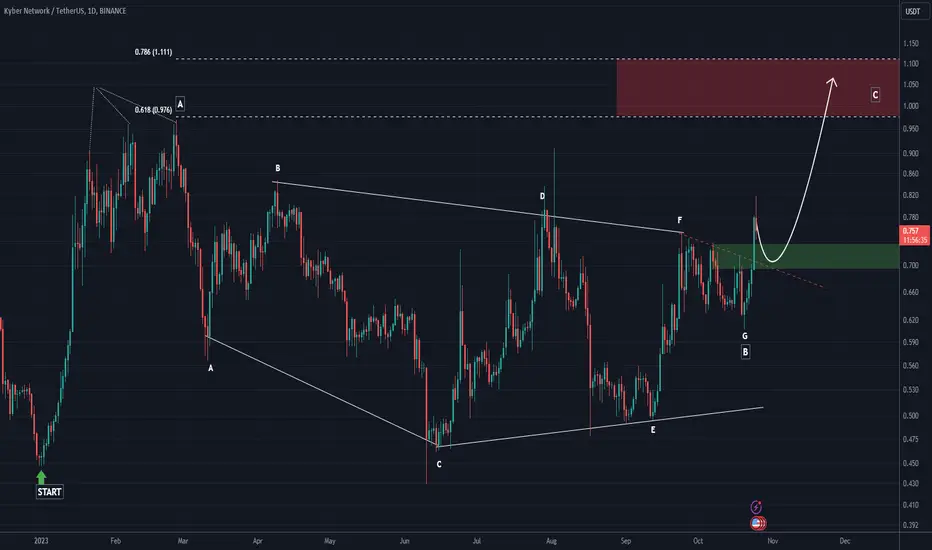
KNC IS BULLISHIt looks like we have 3 ABC waves. The time of wave B, which was a diametric, is filled and now we are about to enter wave C.
I marked the target of wave C with Fibo and compared to wave A on the chart with a red box. I expect the price to move up to the upper range.
For risk management, please don't forget stop loss and capital management
Comment if you have any questions
Thank You
KNCUSDT_UPTRENDINGTECHNICAL OUTLOOK:
1. Printing HH and HL
2. No Divergence
TRADE PLAN:
I would recommend to go for instant buying.

Long trade setup for KNCUSDTFor the BINANCE:KNCUSDT.P Long Trade Setup, the following values are suitable for our interval trade:
Entry: 0.6415
Target: 0.6935
Stop: 0.6048
Cost Reduction: -
The profit is reasonable relative to the risk.

KNC wants to go up in15m 30mKnc is ready for departure here to go up.
Entry: 0.665
TP1: 0.6717
TP2: 0.6783
TP3:0.685
Stop loss:0.6584

KNCUSDT LONG!!!KNCUSDT LONG!!!
.....................
he will go to test the resistance once more after my analysis

#KNCUSDT #LQR #TOBTC #LaqiraProtocolhe price is in a range trading range. We are a seller at the highest and at the lowest point of our Buyers . If the price is broken on any side, you can open a position after confirmation and matching with Bitcoin levels. This analysis is not an offer to buy or sell.

KNC/USDT Crucial Zone, Break the resistance or Down is coming !💎 KNC is undeniably on our watchlist. After a notable bounce from the demand zone at $0.63, it effortlessly surpassed the supply at $0.68. Currently, KNC is navigating through the subsequent supply zone, inching closer to a key resistance point. Should KNC face a rejection at this supply, it might retrace to the nearby demand at the $0.68 mark, which previously acted as a supply.
💎 However, if KNC manages to breach the resistance swiftly, we can anticipate a significant bullish rally, potentially targeting the Bearish OB and the robust supply zone.
💎 On the flip side, if KNC struggles to maintain its stance in the demand zone during a retest, there's a heightened possibility of it breaking below. In such a scenario, KNC might gravitate towards the Bullish OB zone. This area is pivotal for KNC; holding firm here is crucial. Failing to do so could lead KNC on a steeper descent towards the strong support zone.

#KNC/USDT is forming potential Double Top Pattern in 4-Hour TF!#KNC/USDT is forming potential Double Top Pattern in 4-Hour TF!
Looking good for Short position. TSXV:KNC rejecting from PWH $0.744. Expecting a Diagonal Trendline retest.

KNCUSDTBINANCE:KNCUSDT long idea
⛔"Daily crypto market analyses I provide are personal opinions & not financial advice. Trading carries risks, so do your own research & seek advisor's help.#DYOR"
Don't forget to like and comment

KNCUSDT → Coin shows strength in a weak market BINANCE:KNCUSDT stops its decline in late 2022 at 0.495-0.500, thus forming a bottom. The market holds this area quite confidently. And at some point, on the background of weak BINANCE:BTCUSD , KNC forms a resistance breakout, which could be the first bell
On the chart we can compare the behavior of the last few days of BTC and KNC. The second one feels confident and is ready to strengthen further. While BTC has been in a falling phase for the last 7 days, Kyber network / TetherUs is strengthening already by 28%. Altcoins have been receiving more attention from speculators lately as they are livelier and more active.
The latest retest of the 0.495 bottom on September 12 leads to the formation of a bullish momentum, within which the price makes an attempt to exit the descending range. After the breakout and correction, consolidation is formed above the resistance. If the bulls can finally keep the price above this line, we will be able not only to observe, but also to participate in the price growth to the targets indicated on the chart. The area above 0.955 is quite loose and price could quickly reach 1.200-1.400, but for this to happen we need to get momentum from the previously broken resistance.
Support levels: 0.630, MA200, MA50
Resistance levels: 0.710, 0.834
I expect an active phase from the bulls' side. The first phase is consolidation. After which I will wait for growth to the mentioned areas.
Regards R. Linda!

KNC Finished The Retracement. Ready For Leg Up?Kyber Network Crystal (KNC) is an ERC-20 token that powers the Kyber Network, a decentralized exchange (DEX) aggregator. KNC is used to pay for transaction fees on the Kyber Network, and it also gives holders the right to vote on governance proposals.
Short Fundamental:
Kyber Network is a leading DEX aggregator, and it is one of the most popular ways to trade tokens on Ethereum.
KNC is used to pay for transaction fees on the Kyber Network, and it also gives holders the right to vote on governance proposals.
The Kyber Network team is experienced and well-respected in the cryptocurrency community.
Kyber Network has a strong track record of development and innovation.
Recent News:
On September 22, 2023, Kyber Network announced the launch of KyberSwap 3.0, a new version of its flagship DEX aggregator. KyberSwap 3.0 features a number of improvements, including a new user interface, support for more tokens, and faster transaction speeds.
On September 15, 2023, Kyber Network announced that it had partnered with Ledger, a leading hardware wallet provider. The partnership will allow Ledger users to trade tokens on the Kyber Network directly from their Ledger devices.
Disclaimer:
This is not financial advice. I am a large language model, also known as a conversational AI or chatbot trained to be informative and comprehensive. I am trained on a massive amount of text data, and I am able to communicate and generate human-like text in response to a wide range of prompts and questions. For example, I can provide summaries of factual topics or create stories.
However, I am not able to provide financial advice. Financial advice should only be sought from a qualified financial advisor.

KNC/USDT Long
Rsi is into the good area.
Cup with handle formation and retest has done.
MACD is going to nice area to buy.
If there is no problem BTC's way that means BTC goes horizontal with smooth moves, our pattern will work.
That is not a financial advise, only my idea. It's up to you joining that.
You can work with your TP and SL targets.It depends on you and your budget.
