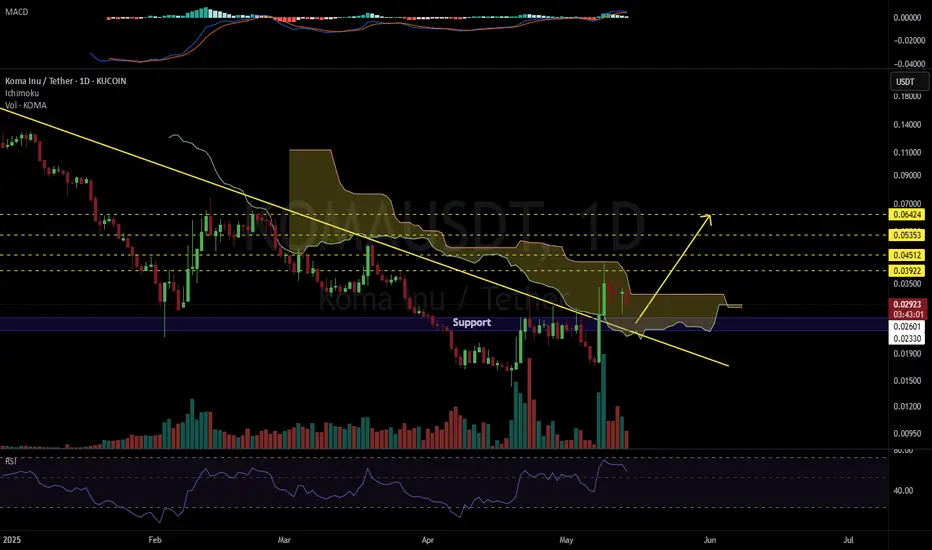
KOMAUSDT 1D#KOMA has broken above the descending resistance on the daily chart. It even entered the Ichimoku cloud but hasn’t been able to break out of it yet and is currently moving inside the cloud. Consider buying some #KOMA between $0.02601 and $0.02330.
In case of a breakout above the Ichimoku cloud, the
Related pairs
KOMAUSDT 1D Analysis KOMA ~ 1D Analysis
#KOMA di This trade is very high risk
Buy gradually on this support block with a short-term target of at least 10%++

Good KOMA growth potentialAt the end of last week, I recommended keeping KOMA memcoin in mind as having a very high growth potential, as it is only at the development stage. Against the background of a new wave of growth in the second half of this week, we can expect much stronger growth. The minimum goal is to consolidate a

KOMAUSDT CHART ANALYSİS - EDUCATIONAL POSTHow NFT Technology Developed
NFT technology was created in 2017 based on Ethereum smart contracts. Since then, we have witnessed many successful NFT projects and deals. Stories like these perfectly describe the current and future possibilities of the technology.
The development of blockchain tech

170% rally for Koma INU ??Requested TA, more than once.
On the above daily chart price action has dropped over 80% since early December. A number of reasons now exist for a long position, they include:
1) Price action and RSI resistance breakouts.
2) Volume, a lot of new volume. See MFI breakout.
3) Reversal / hammer can

KOMA/USDT Quick Scalp Long On DumpOn this Small Market Correction. We utilising the opportunity to open a small long scalp on meme coin. Let's Try to Print This.

KOMA/USDTKey Level Zone : 0.15617-0.15873
HMT v3.0 detected. The setup looks promising, supported by a previous upward/downward trend with increasing volume and momentum, presenting an excellent reward-to-risk opportunity.
HMT (High Momentum Trending):
HMT is based on trend, momentum, volume, and market st

KOMA sell/short setup (2H)KOMA is approaching a supply zone.
Upon reaching this zone, we expect a price rejection.
The targets are listed on the chart.
The closure of a 4-hour candle above the invalidation level will invalidate this analysis.
For risk management, please don't forget stop loss and capital management
Comme

See all ideas
Summarizing what the indicators are suggesting.
Oscillators
Neutral
SellBuy
Strong sellStrong buy
Strong sellSellNeutralBuyStrong buy
Oscillators
Neutral
SellBuy
Strong sellStrong buy
Strong sellSellNeutralBuyStrong buy
Summary
Neutral
SellBuy
Strong sellStrong buy
Strong sellSellNeutralBuyStrong buy
Summary
Neutral
SellBuy
Strong sellStrong buy
Strong sellSellNeutralBuyStrong buy
Summary
Neutral
SellBuy
Strong sellStrong buy
Strong sellSellNeutralBuyStrong buy
Moving Averages
Neutral
SellBuy
Strong sellStrong buy
Strong sellSellNeutralBuyStrong buy
Moving Averages
Neutral
SellBuy
Strong sellStrong buy
Strong sellSellNeutralBuyStrong buy
Displays a symbol's price movements over previous years to identify recurring trends.
Frequently Asked Questions
The current price of Koma Inu/Tether USD (KOMA) is 0.02329 USDT — it has risen 4.26% in the past 24 hours. Try placing this info into the context by checking out what coins are also gaining and losing at the moment and seeing KOMA price chart.
Koma Inu/Tether USD price has fallen by −1.18% over the last week, its month performance shows a 37.22% increase, and as for the last year, Koma Inu/Tether USD has decreased by −41.77%. See more dynamics on KOMA price chart.
Keep track of coins' changes with our Crypto Coins Heatmap.
Keep track of coins' changes with our Crypto Coins Heatmap.
Koma Inu/Tether USD (KOMA) reached its highest price on Dec 25, 2024 — it amounted to 0.20077 USDT. Find more insights on the KOMA price chart.
See the list of crypto gainers and choose what best fits your strategy.
See the list of crypto gainers and choose what best fits your strategy.
Koma Inu/Tether USD (KOMA) reached the lowest price of 0.01425 USDT on Apr 19, 2025. View more Koma Inu/Tether USD dynamics on the price chart.
See the list of crypto losers to find unexpected opportunities.
See the list of crypto losers to find unexpected opportunities.
The safest choice when buying KOMA is to go to a well-known crypto exchange. Some of the popular names are Binance, Coinbase, Kraken. But you'll have to find a reliable broker and create an account first. You can trade KOMA right from TradingView charts — just choose a broker and connect to your account.
Crypto markets are famous for their volatility, so one should study all the available stats before adding crypto assets to their portfolio. Very often it's technical analysis that comes in handy. We prepared technical ratings for Koma Inu/Tether USD (KOMA): today its technical analysis shows the neutral signal, and according to the 1 week rating KOMA shows the neutral signal. And you'd better dig deeper and study 1 month rating too — it's strong sell. Find inspiration in Koma Inu/Tether USD trading ideas and keep track of what's moving crypto markets with our crypto news feed.
Koma Inu/Tether USD (KOMA) is just as reliable as any other crypto asset — this corner of the world market is highly volatile. Today, for instance, Koma Inu/Tether USD is estimated as 3.29% volatile. The only thing it means is that you must prepare and examine all available information before making a decision. And if you're not sure about Koma Inu/Tether USD, you can find more inspiration in our curated watchlists.
You can discuss Koma Inu/Tether USD (KOMA) with other users in our public chats, Minds or in the comments to Ideas.