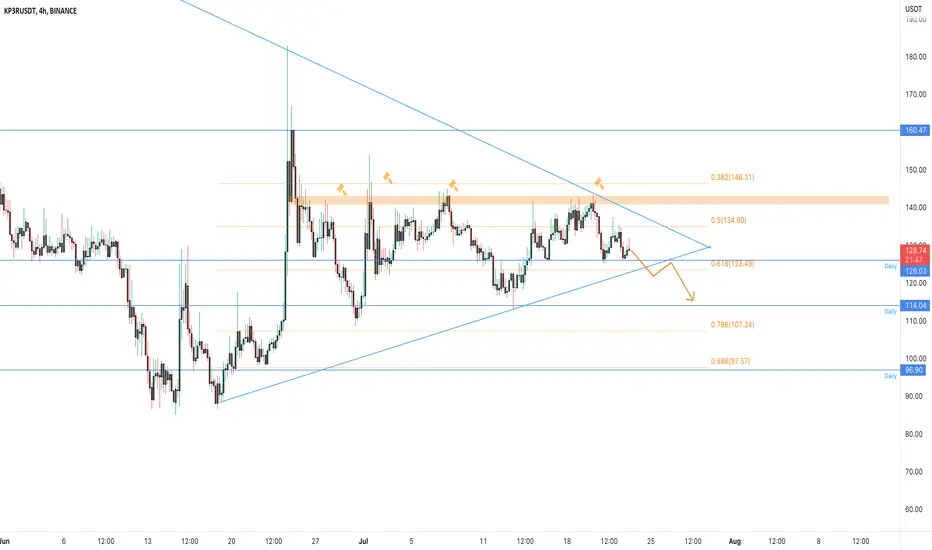
KP3RUSDT is testing the supportThe price created a big triangle on the daily timeframe and now the market is testing the daily support at 128$ on 0.618 Fibonacci level.
On the 4h timeframe, the price got several rejections from 140$ area where the market created a local resistance after a nice bullish movement from 90$ area.
How to approach it?
IF the price is going to lose the 0.618 Fibonacci level support, we could see a bearish impulse until the previous support, so, According to Plancton's strategy , we can set a nice order
–––––
Keep in mind.
🟣 Purple structure -> Monthly structure.
🔴 Red structure -> Weekly structure.
🔵 Blue structure -> Daily structure.
🟡 Yellow structure -> 4h structure.
–––––
Follow the Shrimp 🦐
KP3RUSDT trade ideas

KP3RUSDT | SYMMETRICAL TRIANGLEKP3RUSDT has been trading in a symmetrical triangle. The price action is trading near the falling trendline. The bulls need to break the falling resistance and sustain above it for further continuation of bullish trend . While bears will be in party only below the break of symmetrical triangle.
Trade your levels accordingly.

Overview of the coin KP3RUSDThello trader Today I prepared a new idea for you. Like and subscribe to the channel there is a lot of useful information✅
Today we will analyze with you an interesting coin KP3RUSDT
An ascending triangle has formed on the chart, this can be seen at the lower border of the pattern, it is ascending, now the asset is testing the 0.618 Fibonacci zone, you can see it on the chart.
What I expect, I think the price is able to test up the boundaries of the triangle, after which I will consider short!
I argue:
bitcoin is now bullish, today's withdrawal was a surprise for someone and this may not be the end of the upward movement.


Keep3rV1 KP3RUSDT - Huge breakout! Falling wedge + Elliott Wave- On the daily chart we can see a nice falling wedge / descending triangle, which is very close to a bullish breakout!
- We have a local double top above the wedge and we can definitely buy a breakout above this level for a confirmation trade.
- 0.618 FIB + End of the Wave 1 + End of the Wave 4 is the next resistance, so you can setup your profit target here.
- If we take a look at the volume indicator - there is a strong bullish volume and that is always good to see.
- As per my Elliott wave analysis - Impulse Elliott Wave has been completed succesfully and now I am expecting at least an ABC correction.
- See my ideas about Bitcoin and Ethereum in the related section down below ↓
- For more content, please hit "Like" & "Follow"!

KP3R: +40% tradeKP3R is showing incredible strength despite market conditions, one of the few coins that hasn't taken the hit today.
target: 180 $
stop: close below $ 130

KP3R USDT 4hr Chart Trend AnalysisChannel Up was identified at Jun 26, 4:00 UTC. This pattern is still in the process of forming. Possible bullish price movement towards the resistance 184.7600 within the next 2 days and can go higher to a price action of $260 near the top of the channel.
SHORT-TERM
Stochastic RSI Fast Oversold
Ultimate Oscillator Bearish
ADX Very strong
MOM Bullish
MACD Bullish

KP3R USDT hello guys this is my idea about KP3R /USDT
I thing that sellers from this area will be defend this short position..
and when the price come back to this area, strong sellers will be push down the market again...
Downtrend + previous support become resistance + Strong volume area is my mainly reason for this short trade....
IF YOU LIKE MY IDEA DONT FORGET LIKE AND FOLOW THANKS
REBENGA TURTLE TRADER


KP3R 456% TEST 3 test 3
buy: 150$
TP1 : 326$
TP2 : 383$
TP3 : 420$
TP4 : 501$
TP5 : 517$
TP6 : 560+
SL: CLOSE 4H under 137$


KP3RUSDT - SETUPKP3RUSDT price is trading in a Symmetrical Triangle and decisive point almost there at LTF. So keep an eye on Price action if price print a new LL then bears will take control, if upside break then after touching the roof where already double top formation can resist but this time bulls will have definite power to break above.


KP3R Spot Opportunity Coming SOON!!!!!As we can see since the Keeper Team is announced that the project will shutdown 3 April we've seen a lot of KP3R investors selling and panic, and we're going to retest the ATL again and catch a really good trade right there.

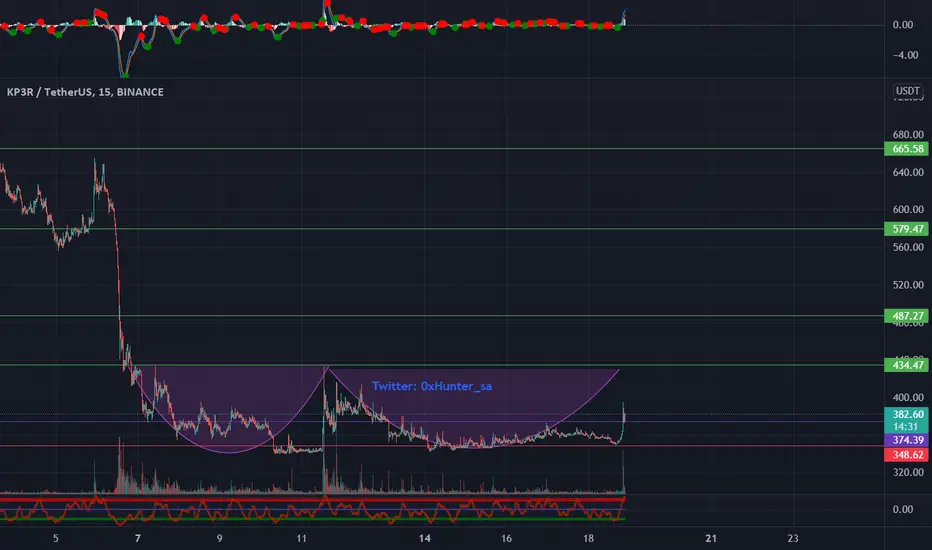
KP3RUSDT LONG POSITION when price break 560 level and 2hr candle close above , the price will target the mention level

KP3RUSDT - SETUPKP3RUSDT price has broken the bearish activity as well as the falling trendline, now bulls can react aggressively and pull the price towards the upside resistance area.


KP3R/USDT ==============
KP3R/USDT
==============
Entry Point :
E1 : 380
==============
Targets :
T1 : 420
T2 : 460
T3 : 500
T4 : 540
T5 : 585
T6 : 630
T7 : 670
==============
Stop Lose : 320
==============