EKHOA - only for share holders / not for new entry .EGX:EKHOA - 1 day timeframe
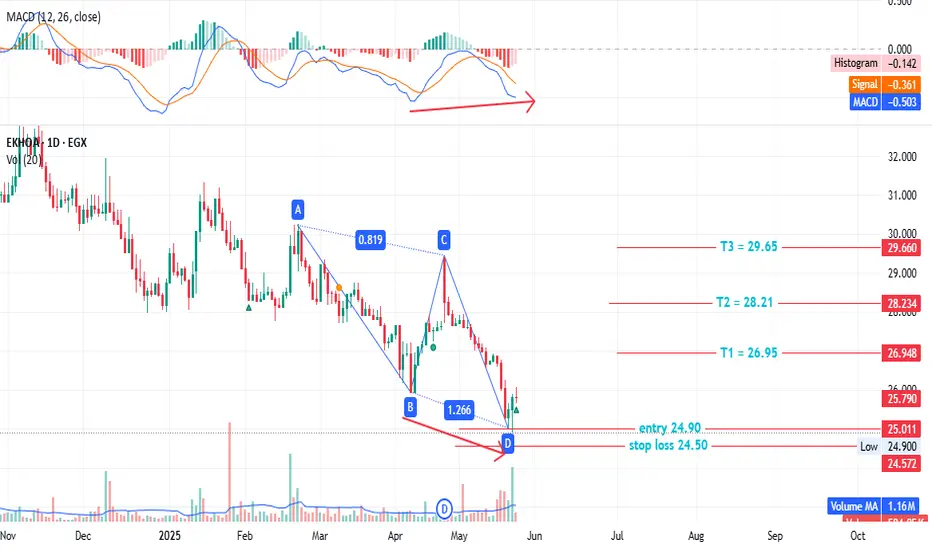
Bullish AB=CD pattern formed / For shareholders only
Stop loss: 24.50
T1: 26.95
T2: 28.21
T3: 29.65
Entry: around 25.00
MACD shows positive divergence daily, with increased volume over the past week, supporting our view.
Note: The stock has been in a downtrend and remains under negativity.
This is not financial advice, just our analysis based on chart data. Please consult your account manager before investing.
Thanks and good luck!
EKHOLDING trade ideas
#EKHOA - only for share holders / not for new entry .EKHOA - 1 day timeframe
Bullish AB=CD pattern formed / For shareholders only
Stop loss: 24.50
T1: 26.95
T2: 28.21
T3: 29.65
Entry: around 25.00
MACD shows positive divergence daily, with increased volume over the past week, supporting our view.
Note: The stock has been in a downtrend and remains under negativity.
This is not financial advice, just our analysis based on chart data. Please consult your account manager before investing.
Thanks and good luck!

EKHOA .....Let's SeeEKHOA, let's see if this analysis would be valid or not. I think 28 level will be the base to go up to reach 38.42, then 48.72 then 59 as third target.

#EKHOA Egyptian stock - great opportunity - great fundamental.#EKHOA time frame 1 DAY
created 3 Bullish Gartley patterns ( patterns by time frame 1 day and anther one by time frame 1 hour ) , so we can see action price in this point but in anther hand we are in a downtrend targeted 27.00 .
Entry level at 30.10 to 30.30
Stop loss 29.00 ( loss may go to up -3.70% )
First target at 31.95 ( with profit around 6% ) , resistance at 31.20
Second target 33.50 ( with profit around 11% )
Third target 34.50 ( with profit 15% )
NOTE : this data according to time frame I DAY , it`s may take period up to 3 months to achieve targets , you must study well the Alternative opportunities before invest in this stock .
Its not an advice for investing only my vision according to the data on chart
Please consult your account manager before investing
Thanks and good luck

#EKHOA#EKHOA time frame 15m
created a bullish Gartley pattern
entry level at 31.80 TO 31.90
stop loss 31.75
first target at 32.10
second target 32.30 up to 32.45 , 32.60
MACD indicator show positive diversion , may that is support our idea.
NOTE : this data according to time frame 15m
Its not an advice for investing only my vision according to the data on chart
Please consult your account manager before investing
Thanks and good luck

Time analysis for EKHOBased of the arc and the time mirror effect. We can detect the end of the sideway area near to one of the lines of the chart Or between them . then if we started up trend we can expect the top near to the right lines.
you will need normal technical analysis to support it when the time come.

Egyptian Kuwaiti is preparing for a nice breakoutDaily chart, the stock EGX:EKHOA is drawing a chart pattern, where the targets up to 41 and 44 will be activated after crossing the resistance zone 31 - 32
The technical indicators RSI and MACD are supporting this view.
Consider a stop loss below 29.5 - 29

EKHO (Egypt) should rebound to 0.750 short-term1-hour chart, EGX:EKHO is trading in a falling wedge.
I am expecting a rebound from this zone 0.720 - 0.725
Closing for 3 hours above 0.725 will push the price to 0.750 passing through some resistance levels 0.732 , 0.740
Currently, the chart's technical Indicator RSI is inclined towards over-sold.
Stop loss below 0.720

EKHOA OUTLOOKWelcome to the daily analysis of EKHOA, a key constituent of the EGX30 index. This analysis provides insights into market movements and potential trading opportunities based on a comprehensive approach utilizing various technical indicators. The analysis is grounded in the following methods:
Ichimoku Kinko Hyo: A versatile indicator providing a holistic view of support, resistance, momentum, and trend direction.
Fibonacci Retracement: Used to identify potential reversal levels by measuring the key Fibonacci levels of recent price movements.
Law of Diminishing Returns: Applied to assess the impact of additional investment or effort in the market, helping to determine optimal entry and exit points.
TRIX (Triple Exponential Average): A momentum indicator that shows the rate of change of a triple exponentially smoothed moving average, aiding in identifying trend reversals.
Trendlines: Essential for identifying support and resistance levels, as well as the overall direction of the market trend.
TSI (True Strength Index): A momentum-based oscillator that helps to identify the strength of a trend and potential reversal points.
Stay tuned for detailed insights and strategic recommendations based on today's market analysis.

Time analyses of EKHO we expect a change in trend in this dates depend on the arc and time cycles of the stock.

Ekhoa Support/ Resistance Ekhoa
near support 30.15
Near Resistance 34.02
Jinny Vip5 Channel
Use it as Support/ Resistance
Best Regards

Advanced Trading Strategies Using Multiple IndicatorsTechnical Analysis Report: Advanced Trading Strategies Using Multiple Indicators
Introduction:
In this educational video, a comprehensive approach to technical analysis is presented, focusing on the identification of trend reversals and entry points in the market. The strategy incorporates a diverse set of indicators and concepts to enhance trading precision and decision-making.
Key Components:
1. Indicators Utilized:
- Fibonacci Retracement (Fibonacci)
- Average True Range (ATR)
- Cumulative Volume Delta
- Smart Money Concepts
- Relative Strength Index (RSI)
- Trailing Stop Loss ATR
- Ichimoku Kinko Hyo (Ichimoku)
2. Objective:
The primary goal of the strategy is to pinpoint the transition from a downtrend to an uptrend, facilitating well-timed trading decisions. By combining various technical tools, traders aim to increase the probability of successful trades.
3. Trading Philosophy:
- The emphasis on Ichimoku Kinko Hyo as a foundational element underscores the strategy's commitment to deriving signals from this powerful indicator.
- The reference to being an "Ichimokian" reflects a dedication to mastering Ichimoku strategies and principles in trading practices.
Conclusion:
By integrating a spectrum of indicators such as Fibonacci, ATR, volume analysis, RSI, and Ichimoku, traders following this methodology can gain a more holistic view of market dynamics. The utilization of these tools in conjunction with each other enhances the ability to identify optimal entry and exit points, laying a strong foundation for informed and strategic trading decisions.
This video encapsulates the essence of the educational content, offering insights into the advanced technical analysis approach advocated by the "ICHIMOKUontheNILE" community.

buy ekhoathe 4 hr chart is making a prefect cup & handle pattern - the price will soon target 60 l.e then 70 l.e
i would take 50% off profit @ 60 L.E

Waiting for EKHO to confirm rebounding!Monthly chart, EKHO is still suffering (relatively) low volume trading, and the last candlestick is not complete.
We need to wait a strong rebound from the support line, and then the crossing of the medium term resistance (GREEN). Above this level (around 1.05), the target will be 1.37 then 1.57 (to test the long term resistance - BLUE line)
Technical indicator RSI is positive in the BUY area.
MACD is negative! Be careful, with the stop loss below the support)

Egypt Kuwait Holding, to rebound from 230, to target 400Daily chart, the stock is pushed down to test the support line, and most probably will rebound from 230.
Above 255, the targets will be in steps reaching to 400
Stop loss should be considered.

EKHO to target 1.4 (medium term)EKHO is getting into the strong buy area.
On the weekly chart, the RSI and channel pattern are supporting this view.
The target is 1.4
Stop loss line is shown in red, znd should be noted.

EKHO, EGX, accumulating to target 1.5EKHO , EGX
On the monthly chart, started the accumulation stage.
To target 1.5 in 14 - 15 months, as long as the stock remains above the support level 0.95

Egyptian Kuwaiti Holding - EGP EGX:EKHOA
Egyptian Kuwaiti Holding has reversed around 34 EGP to continue the uptrend again supported by Stochastic-RSI indicator and last day candle close above previous close.
Also we have clear inverted head and shoulders pattern.
Expected to go up to 38 EGP before the next correction.
