KSMUSDT 1D#KSM is on the verge of breaking out above the descending triangle resistance on the daily chart. Consider buying some #KSM here and near the support level at $14.39.
If a breakout occurs, the potential targets are:
🎯 $21.03
🎯 $24.02
🎯 $27.00
🎯 $31.26
🎯 $36.68
⚠️ Always use a tight stop-loss and apply proper risk management.
KSMUSDT trade ideas

KSMUSDTHello friends, the KSM currency has made a good double bottom and I think it is prone to good growth (this is just my personal opinion, check it out for yourself). Good luck.

KSMUSDT D – Start of Wave 3? After a clear 5-wave impulsive move up, KSMUSDT seems to have completed a deep ABC correction, potentially marking the end of Wave 2.
📉 Wave 1: We had a clean five-wave move from the bottom, which fits classic Elliott Wave structure.
📉 Wave 2: The correction that followed was much deeper than the ideal Fibonacci retracement zone. However, crucially, it never violated the low of Wave 1, which means it still holds valid under Elliott Wave rules. The correction unfolded as a textbook ABC pattern, with Wave C digging deep into the previous structure — showing panic selloff and possibly a final capitulation.
🔄 Key Development Now:
The resistance trendline of the correction has just been broken, suggesting potential momentum shift. This could mark the beginning of Wave 3, which is typically the strongest and most impulsive wave in Elliott Wave theory.
📈 Potential Target for Wave 3: Around the 39.5.80–42.00 area based on Fibonacci projections, but this is an early assumption and requires confirmation by price action and volume.
⚠️ Important Risk Note:
Despite this bullish technical setup, the current market remains risky. The bounce is fresh, and confirmation is still lacking. There's still the possibility of a deeper retest or invalidation of this count if price closes below the base of Wave 1.
🧠 Trade Plan:
- Wait for follow-through confirmation.
- Manage risk carefully — this is an early entry scenario.
- A stop below the recent low (~11.30) would be logical for this wave count.
📊 What do you think? Is this the beginning of a powerful Wave 3, or just another fakeout?
💬 Drop your thoughts or alternate wave counts in the comments!

KSMUSDT 1W AnalysisKSM ~ 1W Analysis
#KSM Buy back gradually from here if you still have confidence in this coin with a short term target of 20%+ from here.
KSM/USDT Market OutlookKSM/USDT Market Outlook
KSM/USDT has confirmed a breakdown below the $16.40 level and is now consolidating within the $15.00 – $16.00 range.
We recommend waiting for a decisive move out of this zone
• A breakout above $16.00 may open up a long opportunity.
• A breakdown below $15.00 would likely present a stronger short setup, aligning with the current bearish structure.
🎖️

KSM Shakeout RetailKSM doing fakeout under $15 and back to the range above $15
THen now create higher low, i think $28 is easy target

KSM Weekly Setup – Breakout Building or More Chop Ahead?🔥 KSM – Breakout or Retest?
🕰️ Weekly Chart: Still holding within a falling wedge—a bullish structure with breakout potential. 👀
📅 Daily Chart: Recently broke out of an ascending channel and is now retesting the support zone.
📍 Key Support: 19.8 – 21.17
📍 Resistance Zone: 23.3 – 26.9
⚡ A solid bounce from support could ignite the next leg higher. But if consolidation continues, expect more chop before a clear move.
Stay focused—this zone could decide the next trend!

ksm break out ksm is promising. I'll try a long posıtıon. if market let it, we will see some green candles
KSM in a Accumulation Wyckoff EventKSM is ready to be bought.
Context:
PS—preliminary support, where substantial buying begins to provide pronounced support after a prolonged down-move. Volume increases and price spread widens, signaling that the down-move may be approaching its end.
SC—selling climax, the point at which widening spread and selling pressure usually climaxes, as heavy or panicky selling by the public is being absorbed by larger professional interests at or near a bottom. Often price will close well off the low in a SC, reflecting the buying by these large interests.
AR—automatic rally, which occurs because intense selling pressure has greatly diminished. A wave of buying easily pushes prices up; this is further fueled by short covering. The high of this rally will help define the upper boundary of an accumulation TR.
ST—secondary test, in which price revisits the area of the SC to test the supply/demand balance at these levels. If a bottom is to be confirmed, volume and price spread should be significantly diminished as the market approaches support in the area of the SC. It is common to have multiple STs after a SC.
Test—Large operators always test the market for supply throughout a TR (e.g., STs and springs) and at key points during a price advance. If considerable supply emerges on a test, the market is often not ready to be marked up. A spring is often followed by one or more tests; a successful test (indicating that further price increases will follow) typically makes a higher low on lesser volume.
SOS—sign of strength, a price advance on increasing spread and relatively higher volume. Often a SOS takes place after a spring, validating the analyst’s interpretation of that prior action.
LPS—last point of support, the low point of a reaction or pullback after a SOS. Backing up to an LPS means a pullback to support that was formerly resistance, on diminished spread and volume. On some charts, there may be more than one LPS, despite the ostensibly singular precision of this term.
BU—”back-up”. This term is short hand for a colorful metaphor coined by Robert Evans, one of the leading teachers of the Wyckoff method from the 1930s to the 1960s. Evans analogized the SOS to a “jump across the creek” of price resistance, and the “back up to the creek” represented both short-term profit-taking and a test for additional supply around the area of resistance. A back-up is a common structural element preceding a more substantial price mark-up, and can take on a variety of forms, including a simple pullback or a new TR at a higher level.

KSM Scalp BUY PositionBeen on the Desk Today for Long.
Longing this here under 17.150 for a scalp toward 17.600 and 17.800.
stop loss 17.020.
Note: Not a Financial Advise.

KSMUSDT 1WKSM ~ 1W Analysis
#KSM Buy gradually from here with a short -term target of at least 20%+. This is the lowest support for now.

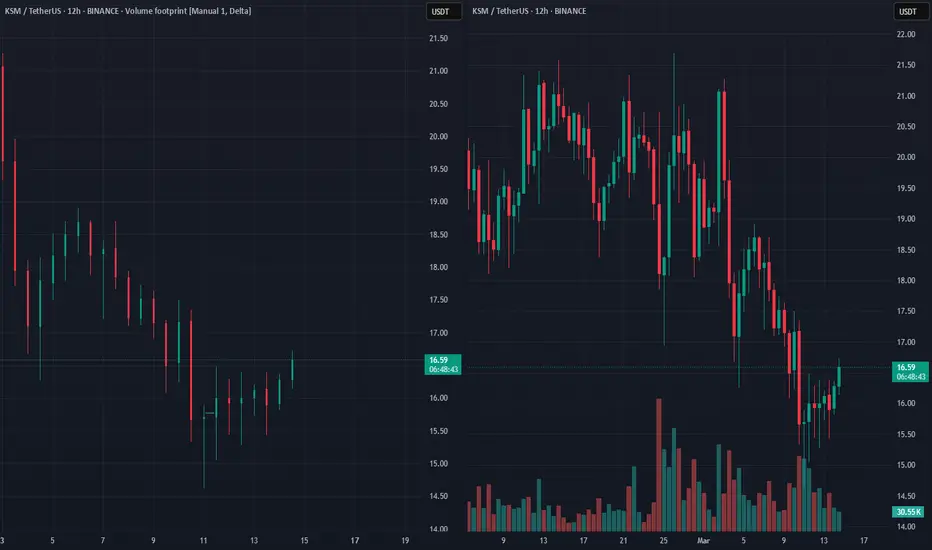
SPOT KSM LONG 14.03.2025Pinning after abnormal purchases.
💰I enter at the market price.
I'll let you know when I record it manually.
‼️Risk per trade: 1% of the allocated funds for spot trading.
Thank you!
Ksm ready to fly Obviously, the entire market turn bullish
Ksm trying to break the resistance line
The resistant line is so weak, for the past 2 weeks ksm try to break it six times
This a strong signal that we going to see the 40$ target 🎯
Monday is the first day of the market
Good luck

KSMa sleeping giant, which is totally oversold, so as i see it and did a visualization on how it must go next 10 days, i think we have 2 options, 1st to go as it is marked, and 2nd to make a pump 80-130%
this is not a financial advice, please trade cautiously.
spot trade
before enter always do your own research
good luck

KSMi think that Kusama it is at the position to make a big move up
long time to see Kusama on the Play.... lets see if we hit 1x
SPOT trade
nfa
dyor

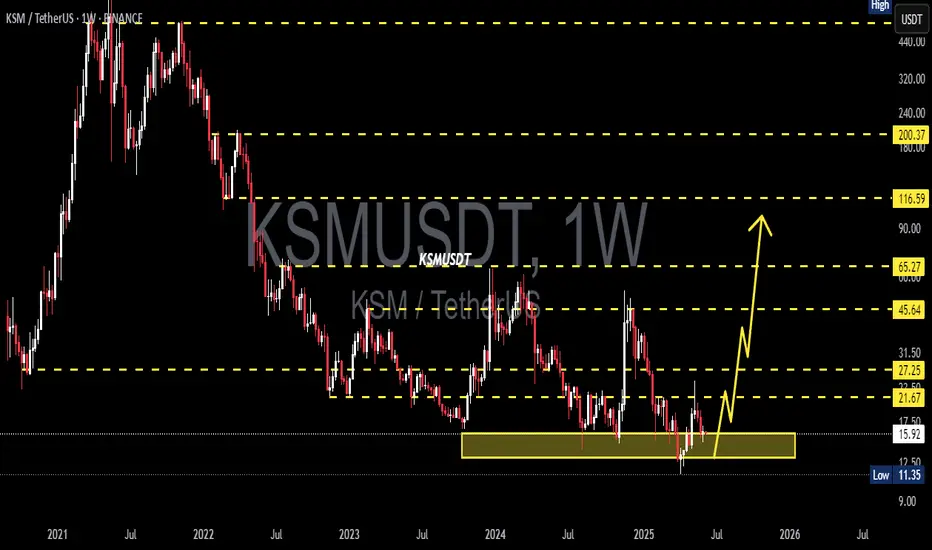
Univers Of Signals | KSM : Accumulation or Breakdown Ahead?In this analysis, I want to review KSM for you. This project is one of the platforms within the Polkadot ecosystem and currently ranks 157th on CoinMarketCap with a market cap of $289 million.
📅 Weekly Timeframe
On the weekly timeframe, we observe a consolidation zone ranging from $15.36 to $55.85. The price has been fluctuating within this range for over two years. By comparing the weekly chart with Bitcoin’s chart, we can see that the KSM/BTC pair is in a downtrend, making it currently not a good buy against Bitcoin.
🔍 However, if we analyze this chart independently, if the price bounces off the $15.36 support and starts moving upward, we can consider buying if it breaks out of the upper box limit. In that case, we can confirm that this two-year range was an accumulation zone, leading to a long-term bullish trend.
📊 The buying volume within this range has been higher than selling volume, which can be a positive sign for buyers and increases the chances of an upward breakout. However, the bullish legs have been relatively short-lived, while the bearish legs have followed more technical and structured movements.
🚀 If the price breaks out of the range to the upside, the technical targets would be $177.68 and $530.43. This means a significant amount of capital would need to enter this coin, which seems unlikely at the moment.
❌ On the other hand, if the price breaks below the range, there will be no significant support left, and we will need to see where the new historical bottom forms.
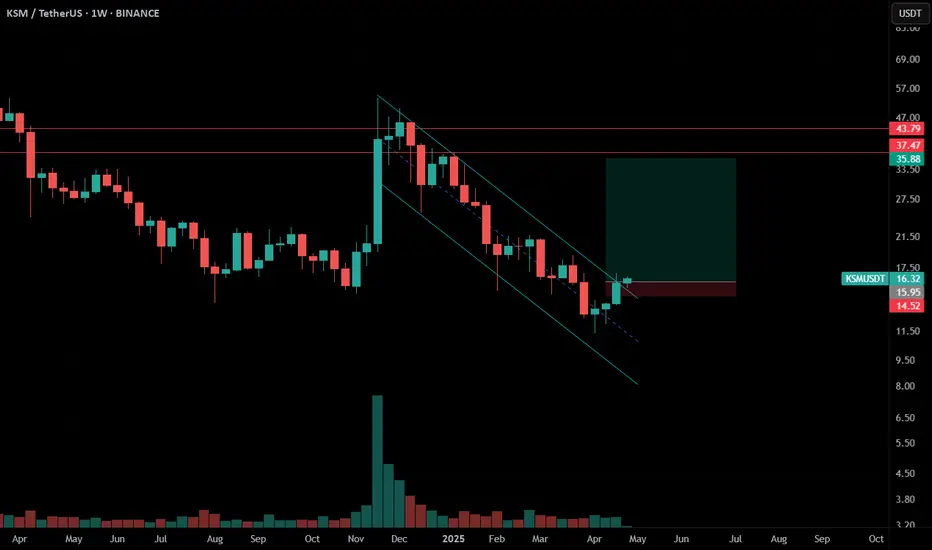
📅 Daily Timeframe
On the daily timeframe, as you can see, the price failed to reach the upper boundary of the range at $60.88 during its last bullish leg and got rejected at $51.21, initiating its downtrend. The price has since moved within a descending channel, approaching the bottom of the range.
✅ Yesterday's candle was heavily rejected from the mid-line of the channel, engulfing all recent candles from the past few days. This indicates strong selling pressure, which could initiate a much deeper downtrend.
📉 If the price breaks below the channel, the downtrend momentum will intensify, potentially leading to a parabolic bearish move for KSM. The key trigger level for confirming a parabolic downtrend is $16.08, and if this level is breached, we can expect a new bearish phase.
🧩 However, if the price breaks above the channel, the current breakout trigger is $22.37. A break above this level could be a buy signal for a long position.
📝 Final Thoughts
This analysis reflects our opinions and is not financial advice.
Share your thoughts in the comments, and don’t forget to share this analysis with your friends! ❤️

TradeCityPro | KSM: Accumulation or Breakdown Ahead?👋 Welcome to TradeCity Pro!
In this analysis, I want to review KSM for you. This project is one of the platforms within the Polkadot ecosystem and currently ranks 157th on CoinMarketCap with a market cap of $289 million.
📅 Weekly Timeframe
On the weekly timeframe, we observe a consolidation zone ranging from $15.36 to $55.85. The price has been fluctuating within this range for over two years. By comparing the weekly chart with Bitcoin’s chart, we can see that the KSM/BTC pair is in a downtrend, making it currently not a good buy against Bitcoin.
🔍 However, if we analyze this chart independently, if the price bounces off the $15.36 support and starts moving upward, we can consider buying if it breaks out of the upper box limit. In that case, we can confirm that this two-year range was an accumulation zone, leading to a long-term bullish trend.
📊 The buying volume within this range has been higher than selling volume, which can be a positive sign for buyers and increases the chances of an upward breakout. However, the bullish legs have been relatively short-lived, while the bearish legs have followed more technical and structured movements.
🚀 If the price breaks out of the range to the upside, the technical targets would be $177.68 and $530.43. This means a significant amount of capital would need to enter this coin, which seems unlikely at the moment.
❌ On the other hand, if the price breaks below the range, there will be no significant support left, and we will need to see where the new historical bottom forms.
📅 Daily Timeframe
On the daily timeframe, as you can see, the price failed to reach the upper boundary of the range at $60.88 during its last bullish leg and got rejected at $51.21, initiating its downtrend. The price has since moved within a descending channel, approaching the bottom of the range.
✅ Yesterday's candle was heavily rejected from the mid-line of the channel, engulfing all recent candles from the past few days. This indicates strong selling pressure, which could initiate a much deeper downtrend.
📉 If the price breaks below the channel, the downtrend momentum will intensify, potentially leading to a parabolic bearish move for KSM. The key trigger level for confirming a parabolic downtrend is $16.08, and if this level is breached, we can expect a new bearish phase.
🧩 However, if the price breaks above the channel, the current breakout trigger is $22.37. A break above this level could be a buy signal for a long position.
📝 Final Thoughts
This analysis reflects our opinions and is not financial advice.
Share your thoughts in the comments, and don’t forget to share this analysis with your friends! ❤️

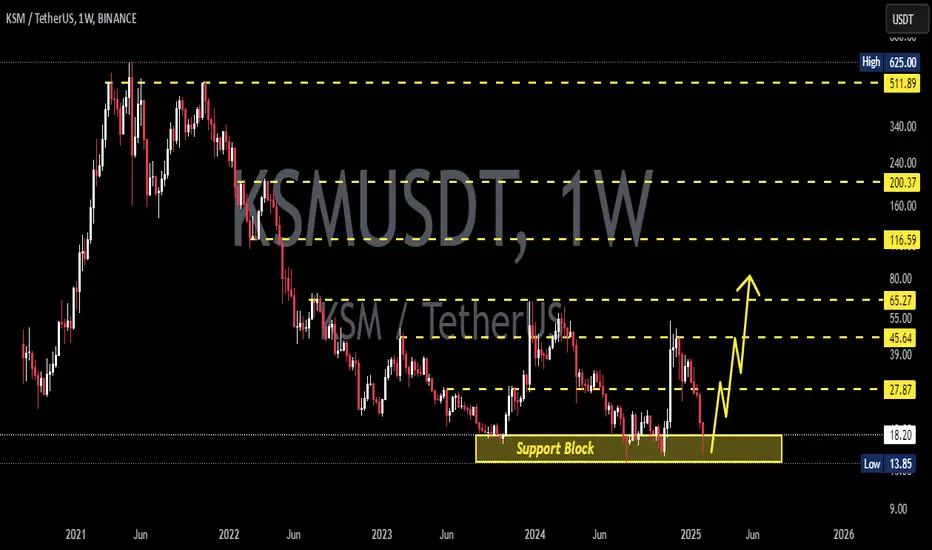
KSM/USDT 1W 🩸 ASX:KSM ⁀➷
#Kusama. Macro chart Another
💯 Intermediate Target - $64
🚩 Macro Target 1 - $87
🚩 Macro Target 2 - $132
🚩 Macro Target 3 - $190
- Not financial advice, trade with caution.
#Crypto #Kusama #KSM #Investment
✅ Stay updated on market news and developments that may influence the price of Kusama. Positive or negative news can significantly impact the cryptocurrency's value.
✅ Exercise patience and discipline when executing your trading plan. Avoid making impulsive decisions driven by emotions, and adhere to your strategy even during periods of market volatility.
✅ Remember that trading always involves risk, and there are no guarantees of profit. Conduct thorough research, analyze market conditions, and be prepared for various scenarios. Trade only with funds you can afford to lose and avoid excessive risk-taking.

KSMUSDT Setup: Will Bulls Step In, or Are We Heading Lower?Yello, Paradisers! Are you keeping an eye on KSM? This setup is shaping up for either a strong bullish recovery or a critical breakdown—and it all hinges on one key support zone. Let's break it down! 👇
💎KSMUSDT is currently showing a proper retracement within a descending channel, which typically signals a high probability of a bullish move ahead. But here’s the catch: the bulls need to reclaim momentum from a critical support zone before we see a confirmed reversal.
💎If KSMUSDT grabs liquidity below and forms a bullish I-CHoCH (Internal Change of Character) on the lower timeframes, it will greatly increase the likelihood of a strong bullish move.
💎However, if we see panic selling or a deeper retracement, we can expect a bounce from the stronger support zone below. At that point, look for bullish patterns like a W formation or an inverse head and shoulders on lower timeframes to confirm the move.
💎If KSMUSDT breaks down and closes a candle below the strong support zone, this will invalidate our bullish idea entirely. In that scenario, it’s best to stay patient and wait for a more favorable price action setup.
Stay disciplined, Paradisers! Remember, it’s all about waiting for the highest probability moves. Jumping in too early can cost you—so keep a close eye on how the price reacts around these key zones.
MyCryptoParadise
iFeel the success🌴

#KSM/USDT#KSM
The price is moving in a descending channel on the 1-hour frame and is adhering to it well and is heading to break it strongly upwards and retest it
We have a rebound from the lower limit of the descending channel, this support is at a price of 19.70
We have a downtrend on the RSI indicator that is about to break and retest, which supports the rise
We have a trend to stabilize above the moving average 100
Entry price 20.00
First target 20.58
Second target 20.95
Third target 21.50

#KSM/USDT#KSM
The price is moving in a descending channel on the 1-hour frame and is adhering to it well and is heading to break it strongly upwards and retest it
We have a bounce from the lower limit of the descending channel, this support is at a price of 18.00
We have a downtrend on the RSI indicator that is about to break and retest, which supports the rise
We have a trend to stabilize above the moving average 100
Entry price 19.59
First target 20.49
Second target 21.65
Third target 23.10

Just shut UP ALL kids, KSM is old money - OLD WHALES GOLDEN EGG800$ is my projection
SHUT UP ALL KIDS! This is most bullish blue chip
BLOOODY MONSTER or PROJECT AND TOKEN.

KSMUSDT 1WKSM ~ 1W Analysis
#KSM If you still have a Conviction on this coin,. This is the lowest support for now. Buy from here with a minimum target of 20%+