$KSM$KSM will get sent soon given the fundamentals around it + the way $DOT looks. market structure wise, i expect these to burst through these resistance areas after a few taps.
KSMUSDT trade ideas

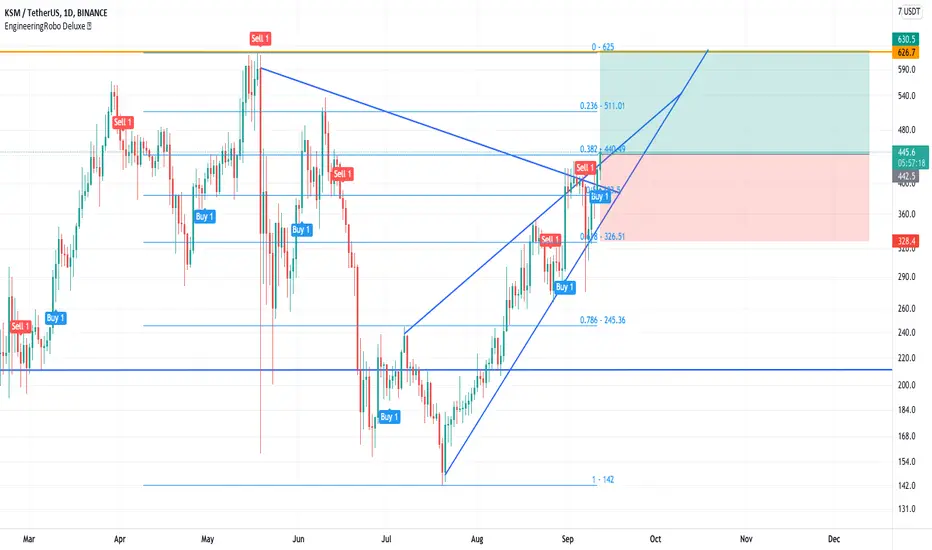
KSMUSDT TECHNICAL ANALYSISThe candle already break out up trend-line and risk/reward ratio show 1.65. We do have 6 hours at the moment for new candle. If the new candle will go lower than $444.4, and next candle stay above $444.4, it may an opportunity for buy. Also we do have BUY 1 signal from @EngineeringRobo as well. This mean when the new candle come and if we still have BUY 1 signal in our daily chart, it may an opportunity for buy too then our next target may be one of the Fibonacci level 0.236. Our last maximum target was $626 and KSM hasn't reach on this number yet. If the candle stay above to up trend-line, it may reach out $626 again. Lets follow our chart closely.
"NFA"
KSMUSDT_ LONGBINANCE:KSMUSDT
Due to the increase in volume and increasing demand, the price of currency can easily achieve its short-term goals of $ 485 and the second target of $ 530 by stabilizing and flooring properly on the $ 430 level. However, all this analysis depends on Bitcoin being a strange behavior. And not unpredictable

KSM REACTION to price 410!!!S/R Level
supply and demand zone
short price 410 to lower prices and SUPPORT ZONE

KSMKSM is beautifully following pitchfork , price is moving so vigorously with volumes that it has broken even the pitchfork levels.

My view on KSMUSDTKSMUSDT running in buying zone.Above 422-425 target 500-550-600++ short term.Should give ascending triangle breakout.

KSMUSDT is testing the lower trendline 🦐KSMUSDT is testing the lower trendline of the ascending channel.
IF the price is going to have a breakout from the weekly suppor t, According to Plancton's strategy (check our Academy ), we can set a nice order
–––––
Follow the Shrimp 🦐
Keep in mind.
🟣 Purple structure -> Monthly structure.
🔴 Red structure -> Weekly structure.
🔵 Blue structure -> Daily structure.
🟡 Yellow structure -> 4h structure.
⚫️ Black structure -> <4h structure.

KSM bullish septemberKSM is in a clear uptrend with great fundamental news and in the context of a bullish crypto market. I am seeing an ascending triangle on the hourly with a price target of atleast 491 (0.786) once it breaks out at 420.


KSM/USDTKUSAMA break the bearish trend line and closed above MA200
THE NEXT TARGETS CAN BE:
TP1: 450
TP2: 560

$KSM pulling out from correction wave hard.Kusama has started a new impulse wave correspoding to the bullish trend continuation. I think it will lead us to another ATH. Expect great entry around this zone.

KSM: TECHNICAL ANALYSIS AND FUNDAMENTAL ANALYSIS GO TO WARTechnically, KSM is poised to commence a rally towards previous ATHs. MACD is showcasing a bullish cross. Stoch RSI is divergent and bullish. RSI has room to delve deeper into overbought territory. Volume is significantly higher than the previous rally that was kickstarted back in February.
However, fundamental analysis dictates that "Buy the rumor! Sell the news". Last time around, the price action played by the book. Will it this time? It's everyone's guess.
I trust the chart and watch the key levels as usual. I expect a bull rally. My prediction is that the price will assail higher levels; however, this is my personal bias according to my reading of the chart. Definitely, with a break below 267, if confirmed, I'm out. On the other hand, with a break above the red zone (the resistance zone), I expect a massive rally, if confirmed. Always remember, every resistance must be retested and held to confirm a bullish breakout.

KSM step buy pointsKSM step buy points
buy in 4 Steps
Remember to like follow if you found this helpful
Comment your ideas
thanks!

KSMAscending waves always form under the red cloud,
After presenting the KSM analysis, the first target was touched (27% profit)
If it crosses the Ichimoku cloud and you do not shop in Pullback, like AVAX, you will only regret it.
A strong trend is emerging to cross the cloud

KSMUSDT had a breakout from the descending channel 🦐KSMUSDT had a breakout from the descending channel, and now the price is testing the daily resistance. IF the price is going to have a breakout, According to Plancton's strategy (check our Academy ), we can set a nice order
–––––
Follow the Shrimp 🦐
Keep in mind.
🟣 Purple structure -> Monthly structure.
🔴 Red structure -> Weekly structure.
🔵 Blue structure -> Daily structure.
🟡 Yellow structure -> 4h structure.
⚫️ Black structure -> <4h structure.

KSMPrevious re-test of this key level KSM followed with a 103%, 114%, & 98% return. We again are coming off a re-rest of this level.

KSM / TETHERUSKSM / TETHERUS
Break the bearish trend since 19/may/2021
Entry / 350
Target/
440
530
620
stop loss / 260

KSM/USDT Cup & Handle Breakout's Next TargetVery strong breakout for KUSAMA, also with strong supports from the 20 EMA & 200 MA. Further boosted by the daily MACD crossover and the Stochastic RSI bounce.

KSM/USDT 1D💵 #KSM/USDT
🟢 Spot (Midterm)
✅ Investment Recommendation
————————————
🔵 Entry Range : 280 - 300 - 340
🔴 Exit Points : 395 - 485 - 985
🛑 Stop Loss : 198
————————————
⚠️ Risk Level : 5/10
💲 3 - 5 % Of Total Assets
————————————

KSM USDT going to range high @ $6.25/$6.50Tapped the 4 hour demand, bottom of this range. Easy move to upside here with stop at bottom of range.

August 31 KSM/USDT wave combined with technical indicators analyThe following is a machine translation.
1. from the k-line pattern, now in the wave 3 wave up. Here the 3rd wave to exceed the 1st wave, is all have the 5th wave still have to continue to observe, first focus on the current 3rd wave.
2. The 2nd wave retracement came to the average line indicator (is this red and green line) to get effective support rebound to take the 3rd wave.
3. From July 21 this wave up to the current volume, are in a state of release up, is expected to promote the subsequent market continue to rise.
4. Here the macd indicator refused to dead cross, there is no divergence, will continue to rise.
5. WT_LB indicator, golden fork. Short-term bullish.
Combined with the described 2, 3, 4, 5 point indicators, is expected to drive the 3rd wave up.


KSMUsdt thsi analyse for frinds
i watch this chart is nice chart
little going up market cap but this low market cap and need going up more
but technicaly is good position and can break white resistance trend line can go up fast and or targets
GL
Supports:
285.3 >>> Entry Point
260.7
232.0
212.2
powerfull Resistance is white trend line you can see in chart and this 2 resistance point. but sec resistance is easy for after break white trend line got that little pull back on trend line and start moving to up
Resistance:
307.4
353.0 >> You can set this for targets but this profit good for leverage traders
Targets:
379.4
495.5
569.7
696.5
For HODL:
1013.7
1323.8
GL guys
HODL targets good for patient remember this
this not about 1 month or 2 month
BTC start for new top can happen this
GL Frinds
