BINANCE: KSM/USDT🛒 Pair: KSM/USDT 🛒
== SPOT==
⏰ 1399/12/26 ⏰
🕰 16/03/2021 🕰
Duration:
📈 SCALP -SHORT 📈
Ex: Binance
#95
🛒 Buy : 325 - 328 🛒
👉Sell Targets👈
🎯TP1: 339 🥉
🎯TP2: hidden🥈 Will fly from here😉
🎯TP3: hidden🥇
🎯TP4: hidden🚁
🎯TP5: hidden✈️
🎯TP6: hidden🚀
⛔️ SL: 290 (if 4 hrs. candle closed below)
KSMUSDT trade ideas


KSMYOUR LIKE OR COMMENT IS MY FUEL FOR NEXT ANALYSIS :)
This is not a financial advice. Always do your own research and always put stoploss in your trade (SL) :) If you want more detailed info how to study and read charts or just need help with some coin, just write to me here a comment, i will try to answer to everybody... i can help you :) all for free, don't worry, BE HAPPY!
If u like the analysis, please feel free to ask any question about this TA or crypto or any coin - leave a comment or like or share the idea, i really appreciate it because then my work makes sense :) thanks!

Kusama (KSM) Is About to Explode!Hello, guys!
Let's talk about Kusama. Now it has a nice growth opportunity against BTC and USDT.
KSMUSDT ANALYSIS
We can see the huge bullish megafon pattern and now the price is about to bounce off it to the upside. The CPR level ($206) acted as an extremely strong support because the price bounced off it multiple times. Also let's notice the bullish hidden divergence with the price oscillator, as you already know it is an uptrend continuation pattern. According to this TA the price target now R1 pivot ($310). This analysis will be invalidated if the price go below the CPR level.
KSMBTC ANALYSIS
If we suppose the bull run continuation for the Bitcoin it is important to know if the KSM is going to over or underperform it.
Let's take a look at the chart below. The price KSMBTC is almost formed the descending triangle pattern with an extremely strong support at current price. During the global uptrend this pattern has a great probability to be broken to the upside. Also the price have the bullish regular divergence with the MFI, thus it is high probability of the local downtrend reverse to the uptrend.
The potential price target for KSMBTC is R1 pivot level, the analysis will be invalidated in case of triangle's breakout to the downside.
DISCLAMER: Information is provided only for educational purposes. Do your own study before taking any actions or decisions.

Kusama ($KSM) almost ready to visit uncharted territory 🌛Okay, so my thoughts on $KSM are very bullish.
I stacked a bunch on the 200$ mark, but this is how I would do it if I were to trade it.
This coin is obviously somewhat correlated to BTC, but there seems to be a clear bottom at 200$ which is interesting and not very normal for an alt-coin.
Let's see how this will play out.

KSMUSDT (KUSAMA) - BIG MOVE ANALYSIS 🔎
- KSMUSDT is consolidating in a symmetrical triangle pattern .
- A relatively big move is imminent.
POSSIBLE PRICE ACTIONS
- Uptrend ⬆️: breakout above the symmetrical triangle's inclined resistance.
- Downtrend ⬇️: breakdown below the symmetrical triangle's inclined support.
TARGETS 🎯
- Uptrend ⬆️: Horizontal resistance levels (R1, R2, R3).
- Downtrend ⬇️: Horizontal support levels (S1, S2).

Kusama (KSMUSDT/KSMBTC) Potential Long Entry 2021/03/05Long Trade Setup #1: Retest and Continuation (200MAs)
1. Price Action: Price needs to move back down to the 200MAs, currently projected to be @ $190 by the time price reaches it, and bounce back up.
2. Trade Entry Confirmations: Bullish candlestick pattern, above average volume, MACD bottoming
DISCLAIMER: I am NOT a financial advisor and this post is NOT financial/investment/trading advice. I am simply sharing what I am doing, and I will not be responsible for any actions you take based on the analysis and comments that I provide. The cryptocurrency market is extremely volatile, and you WILL lose all your money if you are inexperienced! DO NOT risk any money that you cannot afford to lose and always be cautious and manage your risk!
What are your thoughts? Please leave your ideas and analysis in the comments below! Do give the post a like and a follow.

kusama 3.3.21Kusama is looking very powerful. 3 rising structures formed over the past 3 days. Test 300 possibly

$KSM/USDT 2h (Binance Futures) Desending wedge breaking outKusama is looking bullish again after that break-out, let's enter here!
Current Price= 224.844
Buy Entry= 225.523 - 220.523
Take Profit= 241.768 | 273.560 | 299.970
Stop Loss= 207.968
Risk/Reward= 1:1.25 | 1:3.36 | 1:5.11
Expected Profit= +25.20% | +67.98% | +103.50%
Possible Loss= -20.25%
Fib. Retracement= 0.5 | 0.786 | 1
Margin Leverage= 3x
Estimated Gain-time= 10 days

KSM is getting ready, use stoploss, bit riskyYOUR LIKE OR COMMENT IS MY FUEL FOR NEXT ANALYSIS :)
This is not a financial advice. Always do your own research and always put stoploss in your trade (SL) :) If you want more detailed info how to study and read charts or just need help with some coin, just write to me here a comment, i will try to answer to everybody... i can help you :) all for free, don't worry, BE HAPPY!
If u like the analysis, please feel free to ask any question about this TA or crypto or any coin - leave a comment or like or share the idea, i really appreciate it because then my work makes sense :) thanks!

KSM can do a big move upsideKSM is forming bullish structure. Can be xxx% in long term. Added on my watchlist.
****************************************************************************************************************************************************************************************************************************************
This is not a financial advice. Always do your own research and always put stoploss in your trade (SL) :) If you want more detailed info how to study and read charts or just need help with some coin, just write to me here personal message, i will try to answer to everybody... i can help you :) all for free, don't worry, BE HAPPY!
If u like the analysis, please feel free to ask any question about this TA or crypto or any coin and also leave a comment or like or share the idea, i really appreciate it because then my work makes sense :) thanks!

Another Alt party is coming ?!KSM/USDT after breaking the bearish trend line is ready for huge pump.
Although the fundamentally positive news we have for this coin.


🆓Kusama/USDT Analysis (28/2) #KSM $KSMThe selling pressure is dominated and very strong, so it may make KSM lose the 200$ support zone, and that would be a bearish sign
If KSM can stop the decline at this 200$ zone, we could see a recovery to 240$ zone, this would be the strongest resistance in this situation
📅NEWS
👉Mar 31 : Kusama Deployment
📈BUY
-Buy: 135-145$. SL if B
-Buy: 95-105$. SL if B
📉SELL
-Sell: 195-205$ if B. SL if A
♻️BACK-UP
-Buy: 195-205$ if A. SL if B
-Sell: 235-245$. SL if A
-Sell: 280-290$. SL if A
-Sell: 340-350$. SL if A
❓Details
Condition A : "If 1D candle closes ABOVE this zone"
Condition B : "If 1D candle closes BELOW this zone"

KSMUSDT SOON OPEN LONGKSLUSDT is ready to pop as we broke resistance/SUPPORT
EASY SET UP GREAT MONEY

KSMUSDT potential dumpI might be wrong here however big divergences on the 4 hourly chart for MACD an RSI. KSM pushed to make a higher high on 22nd and underwent a bearish series of red doji candles followed by a dip to 200s. My guess is that the next dip will be lower to around 185 region. Plenty alts topped out while BTC has been dropping unless, they have been pushing on to ATH's. KSM chart looking volatile and tired to my mind!
A close on the current 4 hourly candle to below the trend line drawn will further confirm my suspicions.

$KSM needs to bring some price action VERY soon 🧨I would be surprised if this tanks. The testing of new highs looks very bullish.
Let's see how this will play out ⚡️

KSM/USDT BUY SIGNALA little bit late on signal, although KSM still is very bullish and had very little pullback compared to many other altcoins.

Kusama in a perfect trend channelRed (lines) is for selling green is for buying. Easy as that.
Cheers

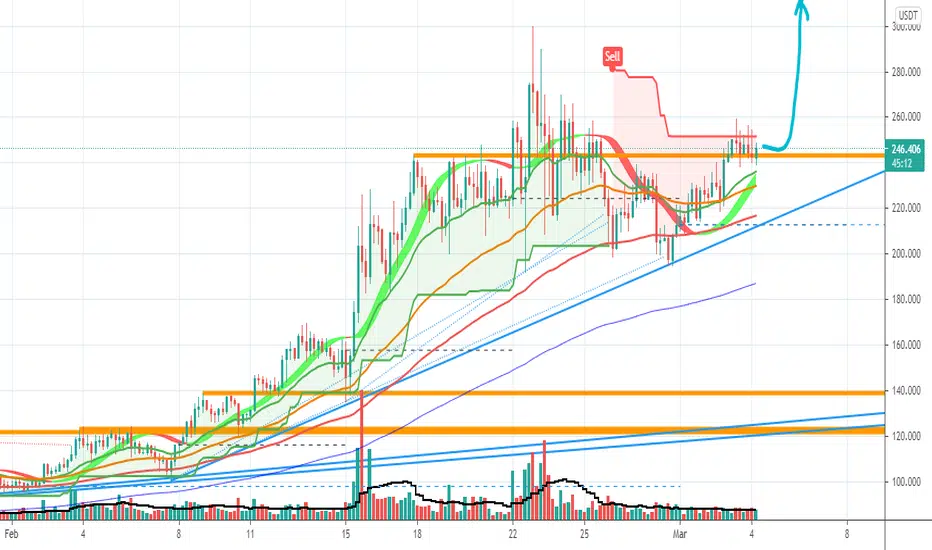
KSMUSDT✅ KSMUSDT got on a rally and pumped up today. too many people might have got into it out of FOMO, but there are still some chances to profit. there might be a downtrend now that the price is pushing the resistance, but in my opinion, it'll get support around 245-260 and go back up again.
⚠️ NOTE: This usually happens when a coin gets hot on crypto platforms. it might go down by a little and then get back up to a new high.

KUSAMA 4h walking upwards, as usual!Technical analysis regarding the price of KUSMANA in relation of dollar Tether for the next scenarios, based on 4 hour movement.
Price moving upward, within that bullish channel. It is respecting several levels of the Up Trend Line (we can even design a channel, with parallel lines)
RSI> 60 and gaining momentum, along with MACD with large buying mass driving the price up!
I believe that in the next scenarios we will have new highs in this very promising cryptography!
disclaimer
*** In accordance with CVM Instruction No. 598, of May 3, 2018, Art. 21, I declare that the recommendations of this analysis reflect solely and exclusively my personal opinions and perceptions and that they were prepared independently and autonomously. Not being considered a purchase and/or sale recommendation. ***
Any questions do not hesitate to contact me. I'm happy to be able to help you in the best way I can. 🙏

$KSM waiting for breakout and retest- waiting for breakout and retest of resistance
volume is great
Large market Caps ---> Mid Caps
- overall bullish on this one
expecting go a lot higher with coming news (release of parachain auctions, etc.)
may go parabolic (FOMO)
- supply 10 M
- Market Cap 2Bn
Disclaimer
I'm not a registered investment, legal or tax advisor or a broker/dealer. All investment/ financial opinions expressed by me are from the personal research and experience. Intended as educational material. Although best efforts are made to ensure that all information is accurate and up to date, occasionally unintended errors and misprints may occur.
Do your Own Research
My content is intended to be used and must be used for informational purposes only. It is very important to do your own analysis before making any investment based on your own personal circumstances. You should take independent financial advice from a professional in connection with, or independently research and verify, any information that you find there and wish to rely upon, whether for the purpose of making an investment decision or otherwise.
Past performance is not a guarantee of future return, nor is it necessarily indicative of future performance. Keep in mind investing involves risk. The value of your investment will fluctuate over time and you may gain or lose money.
