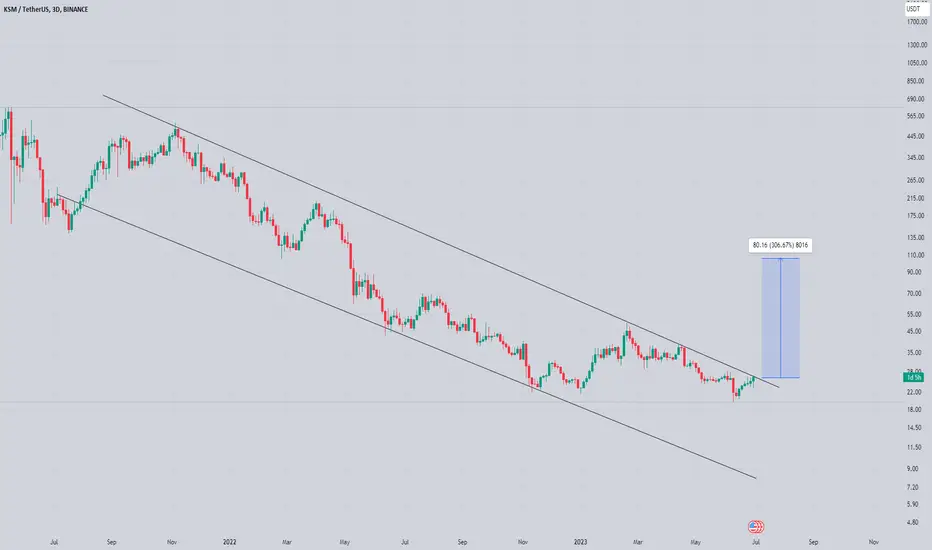
Kusama KSMUSDT Analysis: A Opportunity UnfoldingKusama's chart paints an intriguing picture for both swing traders and crypto enthusiasts looking to fortify their portfolios.
The formation of an Inverted Head & Shoulders pattern signifies a potential upward surge. This pattern, residing in the $20.0 range, holds immense significance. It not only marks a major downtrend resistance but also represents the neckline of pattern.
Adding to the potency of this setup, the RSI indicator has crafted a bullish divergence between the left shoulder and the head of the pattern. This divergence not only validates the pattern but also underlines its strength.
However, a word of caution: while the market excitement might push you towards FOMO, it's crucial to maintain a balanced approach. The ideal entry point lies at a clear breakout, reinforced by solid volume and supported by rigorous risk management.
In summary, this juncture presents a golden opportunity, ripe for those who tread wisely and decisively. Watch the $20.0 level closely; it's the gateway to a potentially profitable trades.
Stay vigilant and trade responsibly. Peace out. 🚀💹
KSMUSDT trade ideas

KSMUSDT Resistance Zone Breakout!KSMUSDT Technical analysis update
Buy zone : Below $19.90
Stop loss : $19.30
Take Profit 1 : $20.50
Take Profit 2 : $21.70
Take Profit 3 : $23.70
Take Profit 4 : $26.00
Always Keep Stop loss
Thanks
Hexa

🚀 "Unlock Massive Profits in KSMUSDT.📣🚀 Ignite Your Crypto Trading Success with KSMUSDT! 📈💥
🔥 Ready for explosive gains? Join the bullish revolution and ride the upward wave of KSMUSDT. 📈💰
💡 Don't miss out on this golden opportunity to multiply your wealth. Embrace the crypto market's potential and capitalize on KSMUSDT's upward momentum. 💪💸
📊 Stay ahead of the game and let the power of knowledge guide your trading decisions. 💡💼
⏳ Time is of the essence! Act now and secure your position for a prosperous future. 💯✨
🔔 Like and share if you're ready to unlock the doors to financial success with KSMUSDT! 🚀🔓💰

KSMUSDTKSMUSDT is trading in bearish trend.
Recently the instrument was trading in range bound and now it has broke the range to downside.
Will this breakout sustain and price will head to even downside?

KSMUSDT in a downtrendHello traders
Let's take a look at Kusama altcoin on 2h time frame.
KSMUSDT remains in a downtrend.
This trend has a high likelihood to continue.
Enter short at the downsloping resitance or if the key support breaks.
Our target for shorts are lows from 15 of June 2023.
Stop loss may be placed at 26,27 usdt.
Good luck!
Please hit a like button and leave a comment to show support to our team!

KSM S&R>>>>>>>>>>I Have Tried My Best to Bring the best Possible outcome in this Chart.
Based on the chart KSM can give more support and rising price continue JUST As long as the price stays above 23USDT.
short term resistance's:
26-27 30-31 38-39
Otherwise price can cprrect to next support's.
All important resistance's in short-Mid -Long term marked on the chart.(scrool your mouse on the chart for more view area's)
It's Not a financial advise.
PLZ DYOR
With hopping succes

KSM/USDT Preparing For a Big pumping ?? Kusama Analysis Today💎 Hello Paradisers, here's a coin to keep an eye on!
💎KSM has successfully broken out of its descending channel and is currently aiming to pierce through the supply zone.
💎If it faces resistance and can't push through, there's a high chance it might descend to the Bullish Order Block. Historically, touch on this OB often results in a significant upward surge.
💎For the entry, consider either jumping in after a decisive breach of the supply or patiently awaiting a touch within the Bullish OB range of 22.90 - 22.10, especially if the supply proves too formidable.
💎Stay sharp, ParadiseSquad! 🌴 Re-evaluate your strategy if KSM ends the day below the 20.90 threshold.

KSMUSDT long scenarioWe expect bullish move on KSM/USDT pair with targets up to $32.49
possible trading plan:
entry 22.45
stop 19.43
tp1 26.09
tp2 28.28
tp3 32.49
Some profit may be taken also on $24.12 and $27.4 levels.
Risk management: main idea is risking nothing more than 1.5% per trade, thus position size will be calculated using the formula:
(Account Size * (Max Risk % X 0.01)) / (Stoploss Price – Entry Price) * Entry Price = Position Size

KSMUSDT needs to create a breakoutThe price of KSMUSDT is currently testing the All-Time Low (ATL) around the $20 area. The ATL is the lowest price level that an asset has ever reached since its inception. This level is often considered significant as it represents a point where historical buyers might become active due to the potential for a rebound.
To potentially reverse the main trend, you've indicated that the price needs to flip the weekly resistance at the $24 area and retest it as new support. This scenario implies a potential bullish breakout where the price moves above a key resistance level and then uses it as a support level.
According to Plancton's Rules, a new long position is suggested if the price achieves this breakout and retest pattern. A long position involves buying the asset with the expectation that its price will rise, aligning with the anticipated bullish reversal of the main trend.
–––––
Follow the Shrimp 🦐
Keep in mind.
🟣 Purple structure -> Monthly structure.
🔴 Red structure -> Weekly structure.
🔵 Blue structure -> Daily structure.
🟡 Yellow structure -> 4h structure.
⚫️ Black structure -> <= 1h structure.
Follow the Shrimp 🦐

Mega Pump in KSMHello Traders!
Welcome back to another trade with analyst Aadil1000x.
Today we are buying at 22.09 and it is in the perfect position to buy. This time it is going to Pump more than 100% and its final destination is above 50% which is more than 125% pump.
KSM is now in the correction phase, once the correction is complete it will fly.
We are using big stoploss and low leverage to avoid monkey chase.
Don't forget to hit the like button and follow to stay connected.

KSM/USDT possible "double bottom?" Hey traders 👋
Let's take a peek at KSM coin as well with a good potential for "double bottom" pattern here.
Why do we see a bullish movement at all?
1) "double bottom" pattern
2) EMAs are far away from market price which means we will go for a re-test to upper zones
3) BB indicator is at a oversold zone
3) RSI is in a process of doing crossover!
If you like ideas provided by our team you can show us your support by liking and commenting.
Yours Sincerely,
Swallow Team
Disclamer:
We are not financial advisors. The content that we share on this website are for educational purposes and are our own personal opinions.

KSM/USDT At The Support Of $23.55Hey traders 👋
KSM coin is next that caught our attention here with a good potential for a breakdown near support zone. We see that there has been multiple attempts before which were getting rejected but this time the pressure seems more aggressive which would result in to bigger movement!
P.S Remember that weekends are not the best times for trading so do keep your risk management in order!
If you like ideas provided by our team you can show us your support by liking and commenting.
Yours Sincerely,
Swallow Team
Disclamer:
We are not financial advisors. The content that we share on this website are for educational purposes and are our own personal opinions.

Kusama - KSM - LONG BREAKOUTKSM broke out a few weeks ago before coming back down and breaking out today.
This gives us the perfect low risk trade opportunity.

KSM Trading PlanHorizontal Supp/Resis in yellow lines
1 Descending resistance line
1 Descending RSI Resistance line

ksm Technical Analysis#ksm Technical Analysis
NYSE:KSM moving in a falling wedge pattern and if see you on bigger timeframe its making a symmetric triangle,
ksm testing the trend line as btc sentiments telling its direction below than it will get reject from here for here
Ksm short entry 23.3-24$
tp1: 22$
tp2: 21$
tp3: 20$
stoploss: 25.7$
virtual Dimension


#KSMUSDT Navigating the Range with Promising Upside Potential💎After a period of range trading, #KSMUSDT appears to have established the boundaries of its trading zone. Currently, the price finds itself near the lower end of this range, with the demand zone forming around the $23 mark.
💎Paradisers, right now the key focus lies on the actions of the #KSM bulls. If they continue to defend this demand zone, it is highly likely that the price will regain momentum and ascend back towards the upper range boundary. The significance of this development cannot be overstated.
💎Now, let us delve into the factors that enhance the probability of an upward move. Firstly, we witness a successful bounce off the demand zone, highlighting the strength of buyer support. Additionally, there is a notable breakthrough above the downtrend trendline, which further reinforces the bullish sentiment. Lastly, today's clear rejection of the 50% Fibonacci retracement level adds another layer of optimism to the equation.
💎Given these observations, it is prudent to assert that the probability overwhelmingly favors the buyers. As the MCP team closely monitors the price action, we anticipate #KSM to embark on an upward trajectory, targeting a double 88.6% Fibonacci retracement level around $26.9. Should this projection materialize, we could witness a notable 13% surge in the coming day or two.
Stay tuned, Paradisers and remember, the Paradise Club is here to guide you on this exciting trading journey! 🌴

Bulls powershow in KSMHello Traders!
Welcome back to another trade with analyst Aadil1000x.
Big bulls are ready to play with KSM and we will see a 40% rise in KSM and it can rise up to 50%.
The next move will be an impulsive move but this accumulation formation is not complete yet. After the completion, it will fly.
KSM Buy limit@ 24.50
Stoploss 22.99(-6.16%)
Target 1, 29.04(+18.36%)
Final Target 34.98(+42.6%)
Don't forget to hit the like button and follow to stay connected.

Ksm Getting Ready For Recovery Towards 100$On Verge Of Massive Breakout Formed Descending Channel In Htfs Incase Of Breakout Expecting Move Towards 100$ Keep Eyes On Ksm For Breakout
The possibility of climbingIf the daily candlestick is above the trend line and above the EMA50 close at the same time... the rise is likely!!


ksmIn a hypothetical channel, if we check, the downward trend line has broken at this time and is pulling back towards the bottom of the channel.
The resistance zones identified in the 4-hour timeframe are very important and indicate selling pressure
The numbers that are significant in the case of motion correction are shown with a green line
All this is a personal opinion and not a basis for decision

Bullish formation in KSMHello Traders!
Welcome back to another trade with analyst Aadil1000x.
This is a buy trade in KSM as the market is now Bullish and KSM is aiming to touch the 28.30 resistance.
KSM Buy Now @ 26.08
Stoploss 25.38(-2.72%)
Target 1, 17.11(+3.8%)
Final Target 28.24(+8.2%)
Don't forget to hit the like button and follow to stay connected.
