Lagrange $LA - post TGE dump recoverySwift path en route $1+
Kept super simplified:
Buy sub $0.50
TPs provided on the chart
Sell $1.9-$2+
Good VCs funded
One of the first on the market in ZKP category next to RISC0, and Succinct that received even more funding --> higher FDV launch target (would imply LA becoming heavily underpriced or becoming a beta play to higher listed FDV competitors later this year)
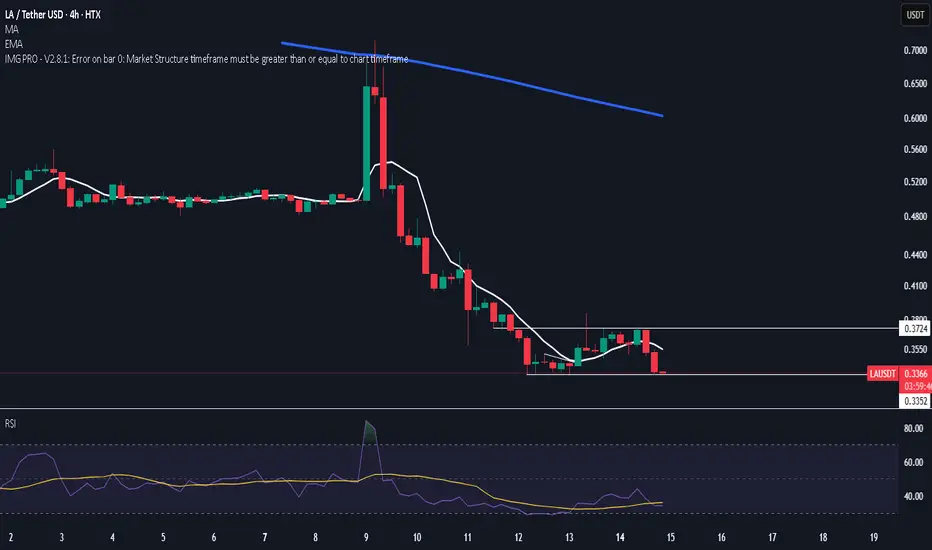
LAUSDT trade ideas

$LA lovely spot to add spot and a 2x in no time imo
been bleeding since listing
should have an attempt at range high by NY for now we deviate
rsi looks reset and sellers may just be thinking not worth it anymore
either way listing cycle dump then accumalate for reversal
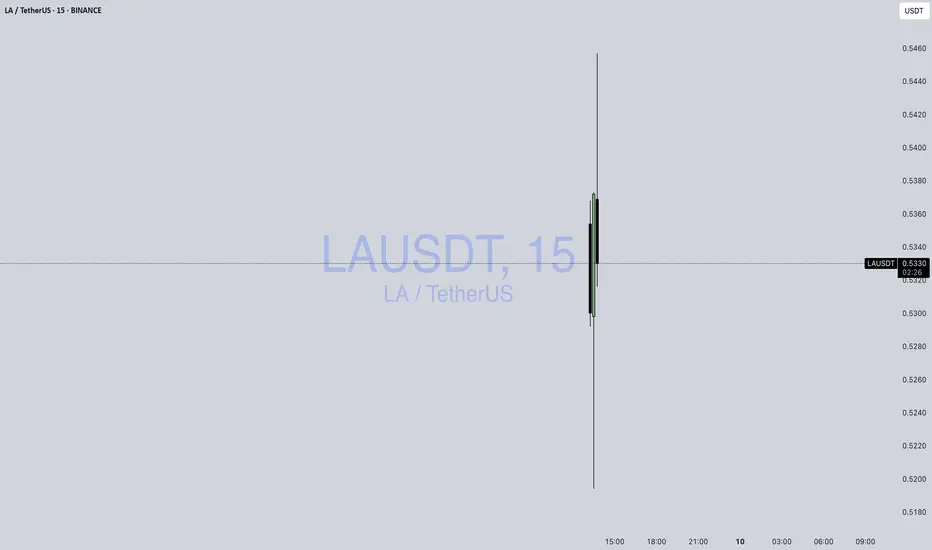
LA / USDTBINANCE:LAUSDT
LA/USDT spiked to 0.5618 but closed lower at 0.5210 (-7.05%), signaling rejection and sell-off.
Volume was strong, suggesting big players or coordinated action.
High volatility → trade cautiously, especially if fundamentals are unclear.
Disclaimer : Not Financial Advice
LA/USDT 50-60% move LA/USDT has successfully found solid support after a prolonged downtrend and is showing early signs of a potential reversal. The price has established a strong base, indicating accumulation in the current range. With volume gradually picking up and market sentiment shifting, LA is now poised for a breakout and trend continuation move.
We're looking at a potential upside of 50–60% from the current level if the setup plays out as expected.

LA Analysis (2H)From the point where we placed the red arrow on the chart, it appears that LA has entered a correction phase.
There isn’t much data available for this coin, but the correction seems to be forming a diametric pattern.
We’ve highlighted the most optimal zone for the completion of the final wave of this diametric (wave G) with a green area on the chart.
Targets are marked on the chart.
A daily candle closing below the invalidation level will invalidate this analysis.
For risk management, please don't forget stop loss and capital management
Comment if you have any questions
Thank You
