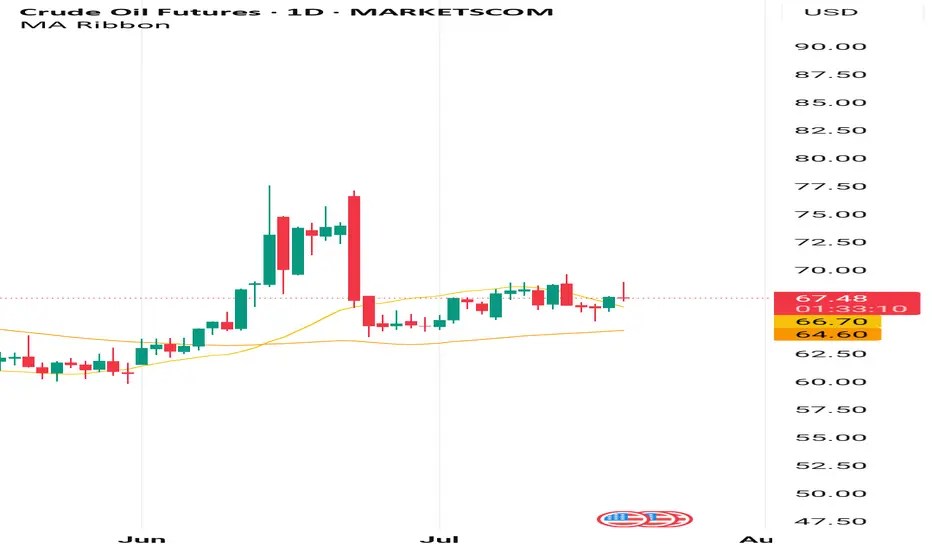
A very strong bullish trend is on the way!!!According to moving averages on daily time frame for oil , a very strong bullish signal is coming and it may leads the price to over 100$!!!!
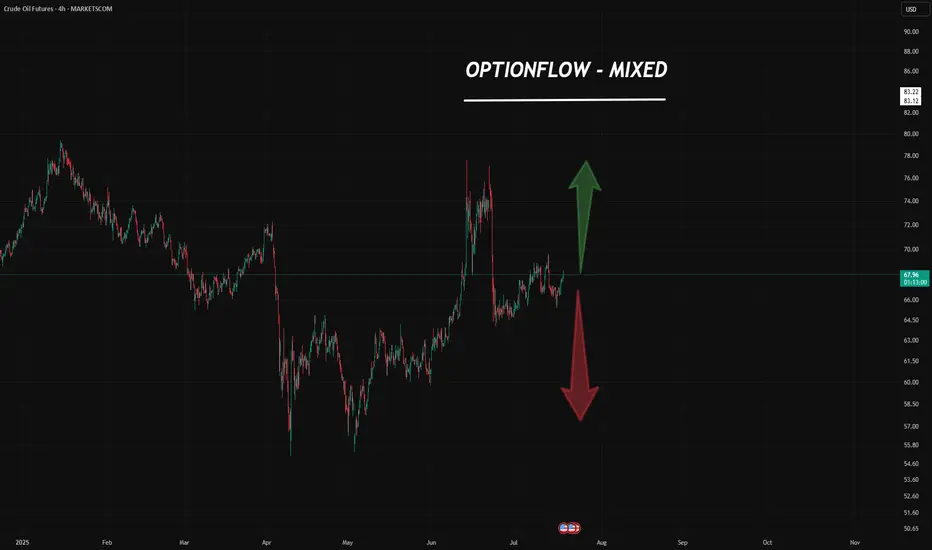
Crude Oil: Bulls vs. Bears — A Market at the Edge
Here’s what we’re seeing from the latest CME block trade data & CME report:
🐻 Confirmed & Detailed Bearish Sentiment
Big players are actively hedging and betting on a drop.
Block trades are targeting key downside levels:
$62.50 , $55.00 , and even as low as $45.00 .
This isn’t noise — it’s instit
Could we see the WTI oil bears getting pleased any time soon?The technical picture of MARKETSCOM:OIL is showing a possible bearish flag formation, which may lead WTI oil to some lower areas. Is that the case? Let's dig in.
NYMEX:CL1!
Let us know what you think in the comments below.
Thank you.
75.2% of retail investor accounts lose money when tradin

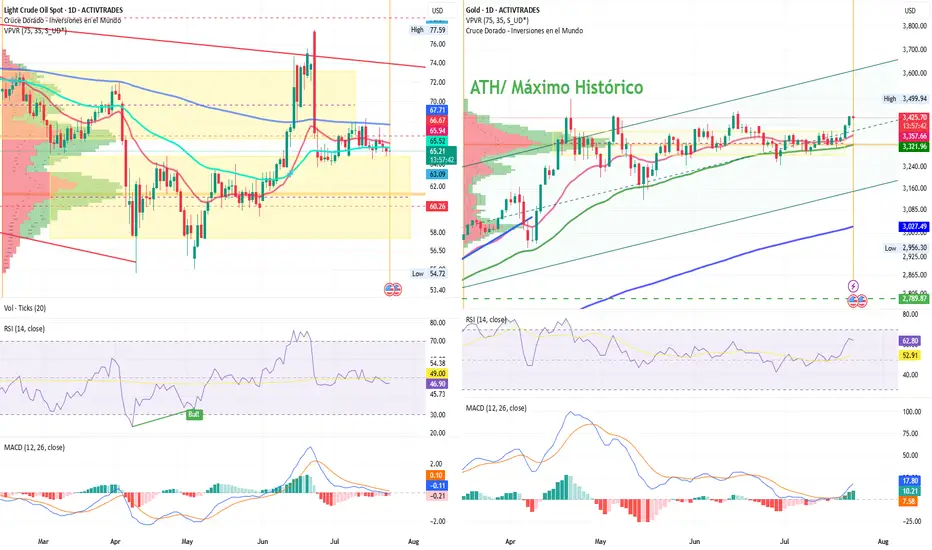
LCrude/Gold: Trump Escalates Tensions with CanadaCanadian Crude and Gold Under Pressure as Trump Threatens New Tariffs Unless Market Access Improves
By Ion Jauregui – Analyst at ActivTrades
Trade tensions between the United States and Canada are once again on the rise following Donald Trump's return to office. The president has set August 1st a
OIL fell sharply, opportunity for upside target of 70$OIL fell sharply and has now been in a contraction for a while, I am taking it into account for a potential breakout, as it shows tightening price action, which reflects market indecision.
Price action has now coiled into a symmetrical triangle, this is often a classic continuation or reversal patte

OIL SELL activated so there oil news on more production to be made tomw or saterday either way the market will flood with oil slamming the price to the floor and introduceing a perfect levraged short

OIL Price Forecast – Bearish Outlook OIL Price Forecast – Bearish Outlook
Oil prices have entered a consolidation phase, showing contracted price action—a classic sign of market indecision or a build-up before the next move.
This range-bound behaviour typically precedes a breakout or breakdown.
Given recent global supply-demand dyn

LCrude Oil: Bearish Pressure as Brazil Emerges as an Energy PHLCrude Oil: Bearish Pressure as Brazil Emerges as an Energy Powerhouse
By Ion Jauregui – Analyst at ActivTrades
LCrude (Ticker AT:Lcrude), which replicates the West Texas Intermediate (WTI) futures contract, has been one of the most volatile assets in 2025. It faces mounting pressure from a growin

Oil and orasiaConsidering the global oil chart and the twelve-day war in the Middle East, and looking at the global gold chart, the estimates of micro and macro investors indicate a decrease in regional tensions and an end to the war, and there is likely to be a further decline in gold and oil prices.
Hussein M.

Crude Oil - Major VolatilityDue to what we are seeing between the US, Israel, and Iran - Oil prices have experienced heightened levels of volatility.
Since September '23, Oil has respected a clear series of lower highs, with each touch of the orange trendline marked by a red X. Every attempt higher has been faded — and nothi

See all ideas
Displays a symbol's price movements over previous years to identify recurring trends.