LDOUSDT trade ideas


IS LDO READY FOR THE MEGA BREAKOUT $4.40 ? LDO is one of the coins we follow for the long term.
Trending chart showing that this coin is able to make a Mega breakout coming time, but first of all, it's important to know that we are into a bear market, and even on this trend LDO still seems to have some interesting increase effects.
$2.50 is an important target where our focus is for the coming time, with the possibility of a high 4 USD.
We follow the most coins data online live, LDO shows a difference in data depending on increased view than most coins.


LDO 1D TF Bull Flag. LDO is the Best LSD 💧 Project in Crypto💫 BINANCE:LDOUSDT.P
Hello Traders,
As we can see LDO in a solid Bull Flag in 1D TF, which its trying to penetrate, marked above the red line, if PA break over, the bull flag shall be activated. The white dotted line as one of the first target area, which is in the geometric cycle design.
Below are are amazing Fundamentals about Liquid staking derivative (LSD project)
"The Rise of LDO Coin and Liquid Staking Derivatives: A Game-Changer for Staking Investors"
Introduction:
LDO Coin and liquid staking derivatives are innovative solutions that have emerged in the cryptocurrency market, revolutionizing the staking landscape. In this article, we explore the concept of LDO Coin and the potential of liquid staking derivatives, highlighting their benefits and implications for staking investors.
Understanding LDO Coin:
LDO Coin, short for Liquid Staked-Derivative Optimistic, is a cryptocurrency that combines the advantages of staking and liquidity. Unlike traditional staking, LDO Coin enables users to unlock the liquidity of their staked assets, allowing them to trade or utilize their holdings without waiting for the staking period to end.
Enhanced Liquidity:
By utilizing LDO Coin, staking investors can access enhanced liquidity for their staked assets. Instead of being locked up for a specific duration, LDO Coin holders can freely trade or transfer their tokens, providing greater flexibility and the ability to seize investment opportunities as they arise.
Liquid Staking Derivatives:
Liquid staking derivatives are financial instruments built on the LDO Coin infrastructure. These derivatives enable users to participate indirectly in staking rewards by owning synthetic assets that represent a portion of the staked assets. This innovation allows investors to benefit from staking rewards without actually participating in the staking process.
Mitigating Risks:
Liquid staking derivatives can help mitigate some of the risks associated with traditional staking. As staking assets are typically exposed to risks such as slashing penalties or network vulnerabilities, liquid staking derivatives provide a layer of insulation by allowing investors to hold synthetic assets rather than directly exposing their assets to these risks.
Expanding Staking Participation:
LDO Coin and liquid staking derivatives have the potential to expand staking participation by attracting a broader range of investors. By providing liquidity and mitigating risks, these innovations make staking more accessible and appealing to those who may have been hesitant to participate in the past.
Regulatory Considerations:
The emergence of LDO Coin and liquid staking derivatives also raises regulatory considerations. As these products combine elements of staking and trading, regulators will likely assess their compliance with existing financial regulations and ensure appropriate investor protection measures are in place.
Future Outlook:
The adoption of LDO Coin and liquid staking derivatives is likely to grow as more investors recognize the benefits they offer. This development has the potential to reshape the staking landscape, providing greater liquidity, reducing risks, and expanding opportunities for staking investors.
Conclusion:
LDO Coin and liquid staking derivatives represent a significant advancement in the world of staking, providing stakers with increased liquidity and risk mitigation. As the market continues to evolve, it is essential for investors and regulators to stay informed about these innovations and their implications for the cryptocurrency ecosystem.
Other promising Liquid staking derivative (LSD projects) are FXS and RPL
At the time to charting this, LDO was trading 2.2112
Always DYOR ✔️
Trade well my friends
Stay SAFU, and Let that Sink in 😉


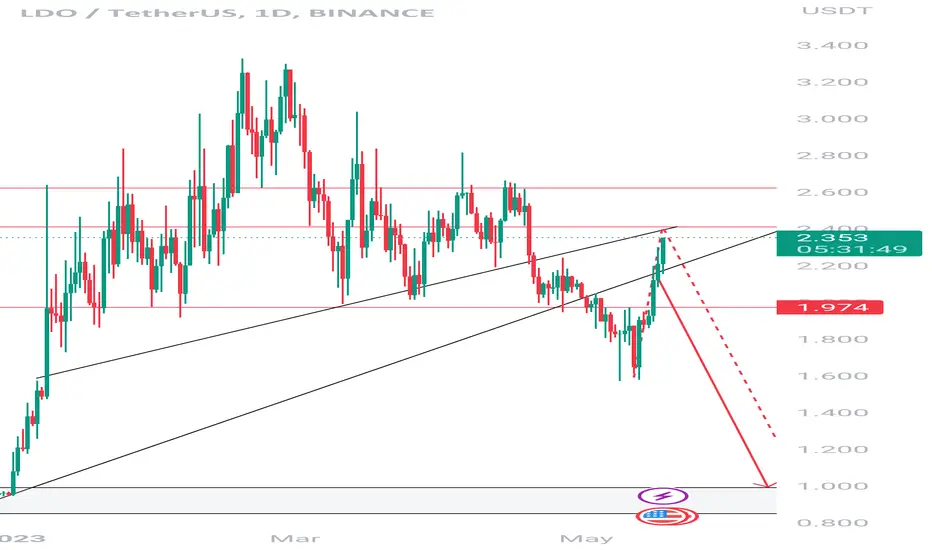
LDO big bullish triangleThe instrument approaches the resistance level for the third time and trades near it. Increased volumes at the level, rising highs indicate that there is a high probability of a breakdown after trading. After the impulse growth, a cascade of resistance levels was formed, with large purchase orders in the glass. According to the combination of factors, with a local correction in the Long with the withdrawal of liquidity beyond the levels.


LDO - Still Holding the LowFrom our previous post "LDO - Just Hit A Bottom" we can see that LDO has respected that bottom and given us more bullish confirmations.
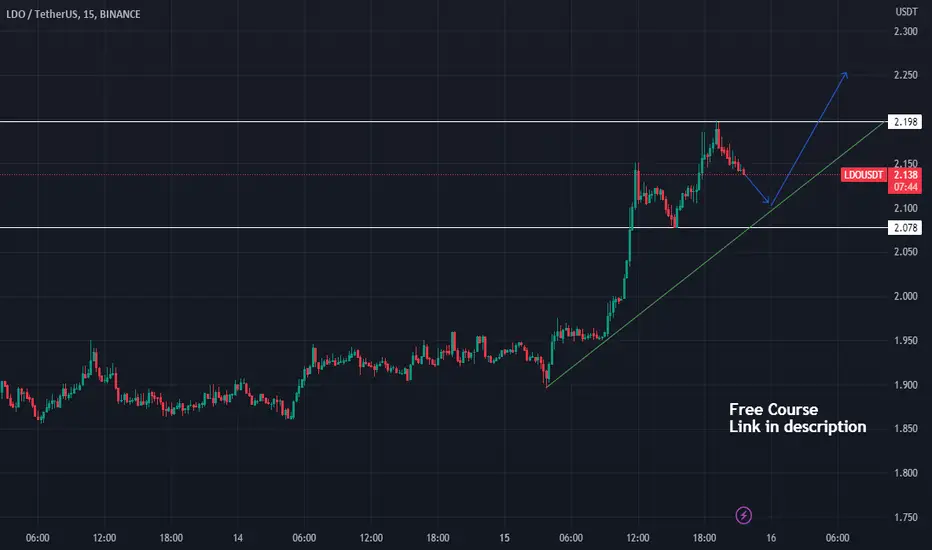
The chart on the left shows the 3 day (longer term timeframe) and the chart one the right shows the 1 Hour (Shorter Timeframe).
On our 3D we can see we have respected our trendline (green circles). We also had tweezer bottoms on the 3D and so far our candle bodies are still respecting the 0.618.
On the 1H it looks like we are forming a W pattern. A breakout of the neckline could send us around $2.40. We also created a double bottom in price.

Long LDO Entry Here is My Study on LDO
Welcome to my channel! Here you'll find daily technical analysis ofthe latest trends in the crypto market. From Bitcoin to altcoins, I'lIl be sharing my insights and predictions to help you make informed decisions
about your investments. Follow me for the latest updates and join the conversation in the comments!
Crypto technical analysis uses past price history to predict future price. It's not a guarantee and shouldn't be relied on solely for investment decisions. Consider other factors such as market trends, economic strength and
information dissemination. Use with caution.
This Is Not A Finacial Advise


LDO - Just Hit A Bottom?LDO is setting up for a very good long trade. Currently we are maintaining our 0.618 as support with daily candle bodies. We created a dragonfly doji reversal candle on the daily and we are holding a very key level on our RSI trend. Of course there is a lot of uncertainty with CPI and BTC tomorrow, but LDO does look extremely bullish from the charts.


